


Analyze with AI
Get AI-powered insights from this Mad Devs tech article:
According to research by the Society for Human Resource Management and Gallup, less than 20% of employees feel their company's reviews of their performance inspire them to improve their work. Likewise, 95 % of managers aren't content with their companies' systems for reviews. As such, it would seem that employees have a negative, or at the very least complicated, relationship with monitoring and reviewing performance. Software developers encounter more challenges than other employees in this regard since there is commonly a knowledge gap between those conducting reviews (the business side) and those "on the ground," the developers.
Despite the challenges of creating effective review systems, it is important to monitor workflows, infrastructure, and employee performance to ensure that customers receive the expected results. Given the many metrics involved in software development, a proper approach to measuring performance and productivity should support the professional development of engineers and the creation of high-quality products.
No data means no progress
Mad Devs believes in tracking the metrics our engineers produce for two reasons:
- Support: Developers require guidance and assistance with challenging tasks and when they want to develop their professional skills. Without objective data, it's hard to understand if there is a problem.
- Quality control: Creating great products and delivering excellence to our clients means understanding how processes are working, what is happening in projects, and what, if any, issues have appeared.
However, before any team or business can track data, it has to be created. That is why Mad Devs requires team members to leave artifacts on their work with the following tools and practices:
- Comments
- Worklogs
- Stand-ups
- Task trackers
The rest of the article will provide more details and explain the importance of these artifacts and habits, such as tracking software development metrics beyond code-related activities.
Software development metrics
Most software companies have one or more teams of developers, and each team includes several individuals. These obvious facts are important to remember when evaluating the performance of software development within a given business. Likewise, the metrics Mad Devs employs can be divided into hard and soft skills. Together, this information provides signals on how a team is performing and how the individuals within it are working on their tasks.
This data refers to the hard skills of software development.
Cycle time: Shows the time it takes developers to start a task and complete it. A shorter cycle time indicates faster delivery.
Lead time: Displays the total time from when a request is made to when it's delivered, including waiting, development, and testing.
Throughput: This refers to the number of tasks (features, bug fixes, etc.) a team completes in a specific time period. Higher throughput often reflects better team efficiency.
Velocity: Shows the amount of work (usually in story points) a team finishes in each sprint. This metric can be used to predict future work capacity.
Code churn: Used to understand how much code is rewritten once it's written. If this metric is high, that could mean planning or misaligned objectives.
Defect rate: A means of understanding the quality of code that displays the number of bugs or issues in relation to features.
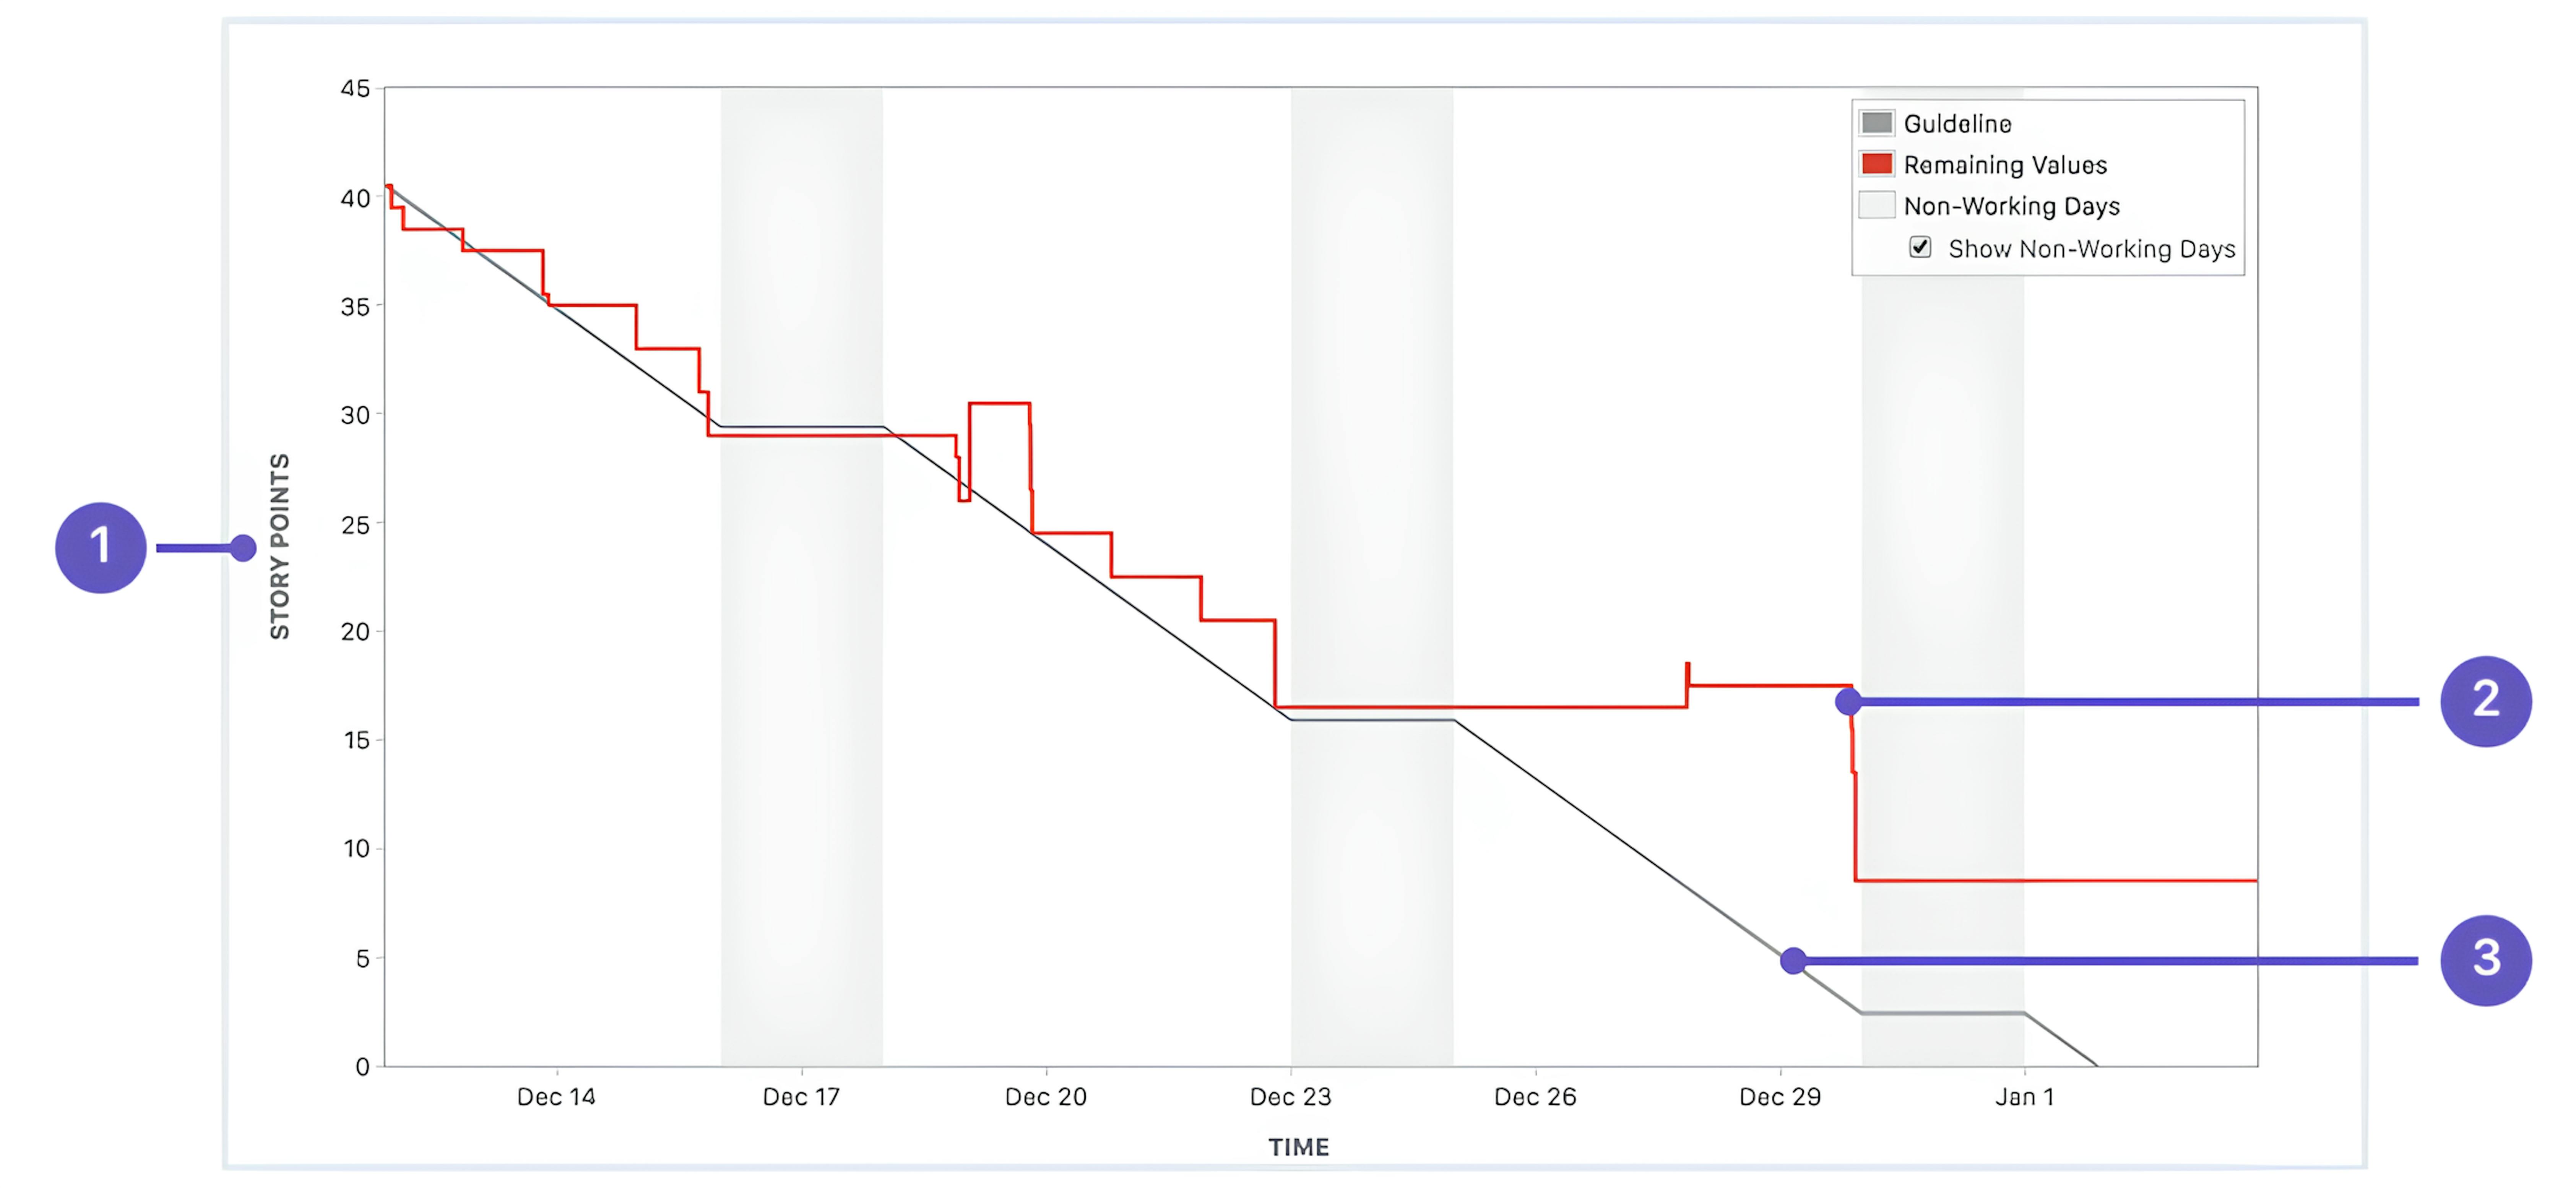
Sprint burndown: Shows the amount of work remaining over the course of a sprint. A consistent downward trend reflects balanced task allocation and steady progress.
Deployment frequency: Tracks how regularly updates are pushed to production. Frequent, incremental updates suggest streamlined DevOps workflows.
Mean time to recovery (MTTR): Represents the average duration to resolve production issues. Quicker recovery signals robust incident response practices.
Code review time: Measures the duration needed to complete the code review process. Faster reviews balance speed and code quality.
Work-in-progress (WIP): Indicates the number of tasks being actively worked on. Limiting WIP helps prevent delays and maintain focus on priorities.
Soft skill metrics
To consider a developer's overall performance, it is helpful to understand how they interact with their colleagues and the company. These metrics are difficult to measure with specific data; however, they add to the understanding of productivity and performance.
- Participation in discussions: How often engineers ask questions and make suggestions in daily syncs and other meetings with colleagues and business stakeholders. This demonstrates interest and investment in a project.
- Recognizing the context: Approaches to development depend on the needs of the business and project. Engineers can achieve mutual understanding and agreement with the client on these details to solve problems without creating them.
- Using ready-made solutions: Communicating with teammates can save time when someone has a solution for an issue or experience with a similar one.
- Giving reports: Daily activities, such as stand-ups and comments in tasks, provide useful information to teammates and demonstrate an engineer's commitment to a project and their work.
- Initiative: Such as objective arguments in favor of a particular solution or requesting assistance. Both of these actions demonstrate that an engineer cares about their work and wants to perform well.
- Responding to criticism and feedback: It is important to understand, through stand-ups and comments, how engineers react to criticism of their work or feedback in general. Their responses can demonstrate a willingness to compromise and grow or a lack of appreciation for different opinions.
- Punctuality: If an engineer completes tasks within the deadline, responds to messages in a timely manner, and arrives at meetings on time, including virtual ones, they are showing a commitment to high performance.
These areas can be measured either directly or indirectly through the activities mentioned earlier, such as stand-ups, worklogs, and comments. Software developers who perform these activities throughout the day create this data, which instruments collect and analyze.
Collecting metrics
Information radiators
This is a generic term for a display or chart that visualizes key project or team data, designed to communicate important information quickly and effectively to everyone involved. Typically placed in a common area or accessible digitally, information radiators provide real-time updates on metrics, progress, and issues.
Radiators help teams and businesses keep a project moving and improving and also make it easier to identify bottlenecks or obstacles and maintain a record of what team members are doing.
Examples of information radiators
Radiators can be physical illustrations or digital within project management platforms. Common examples in software development include:
- Kanban boards
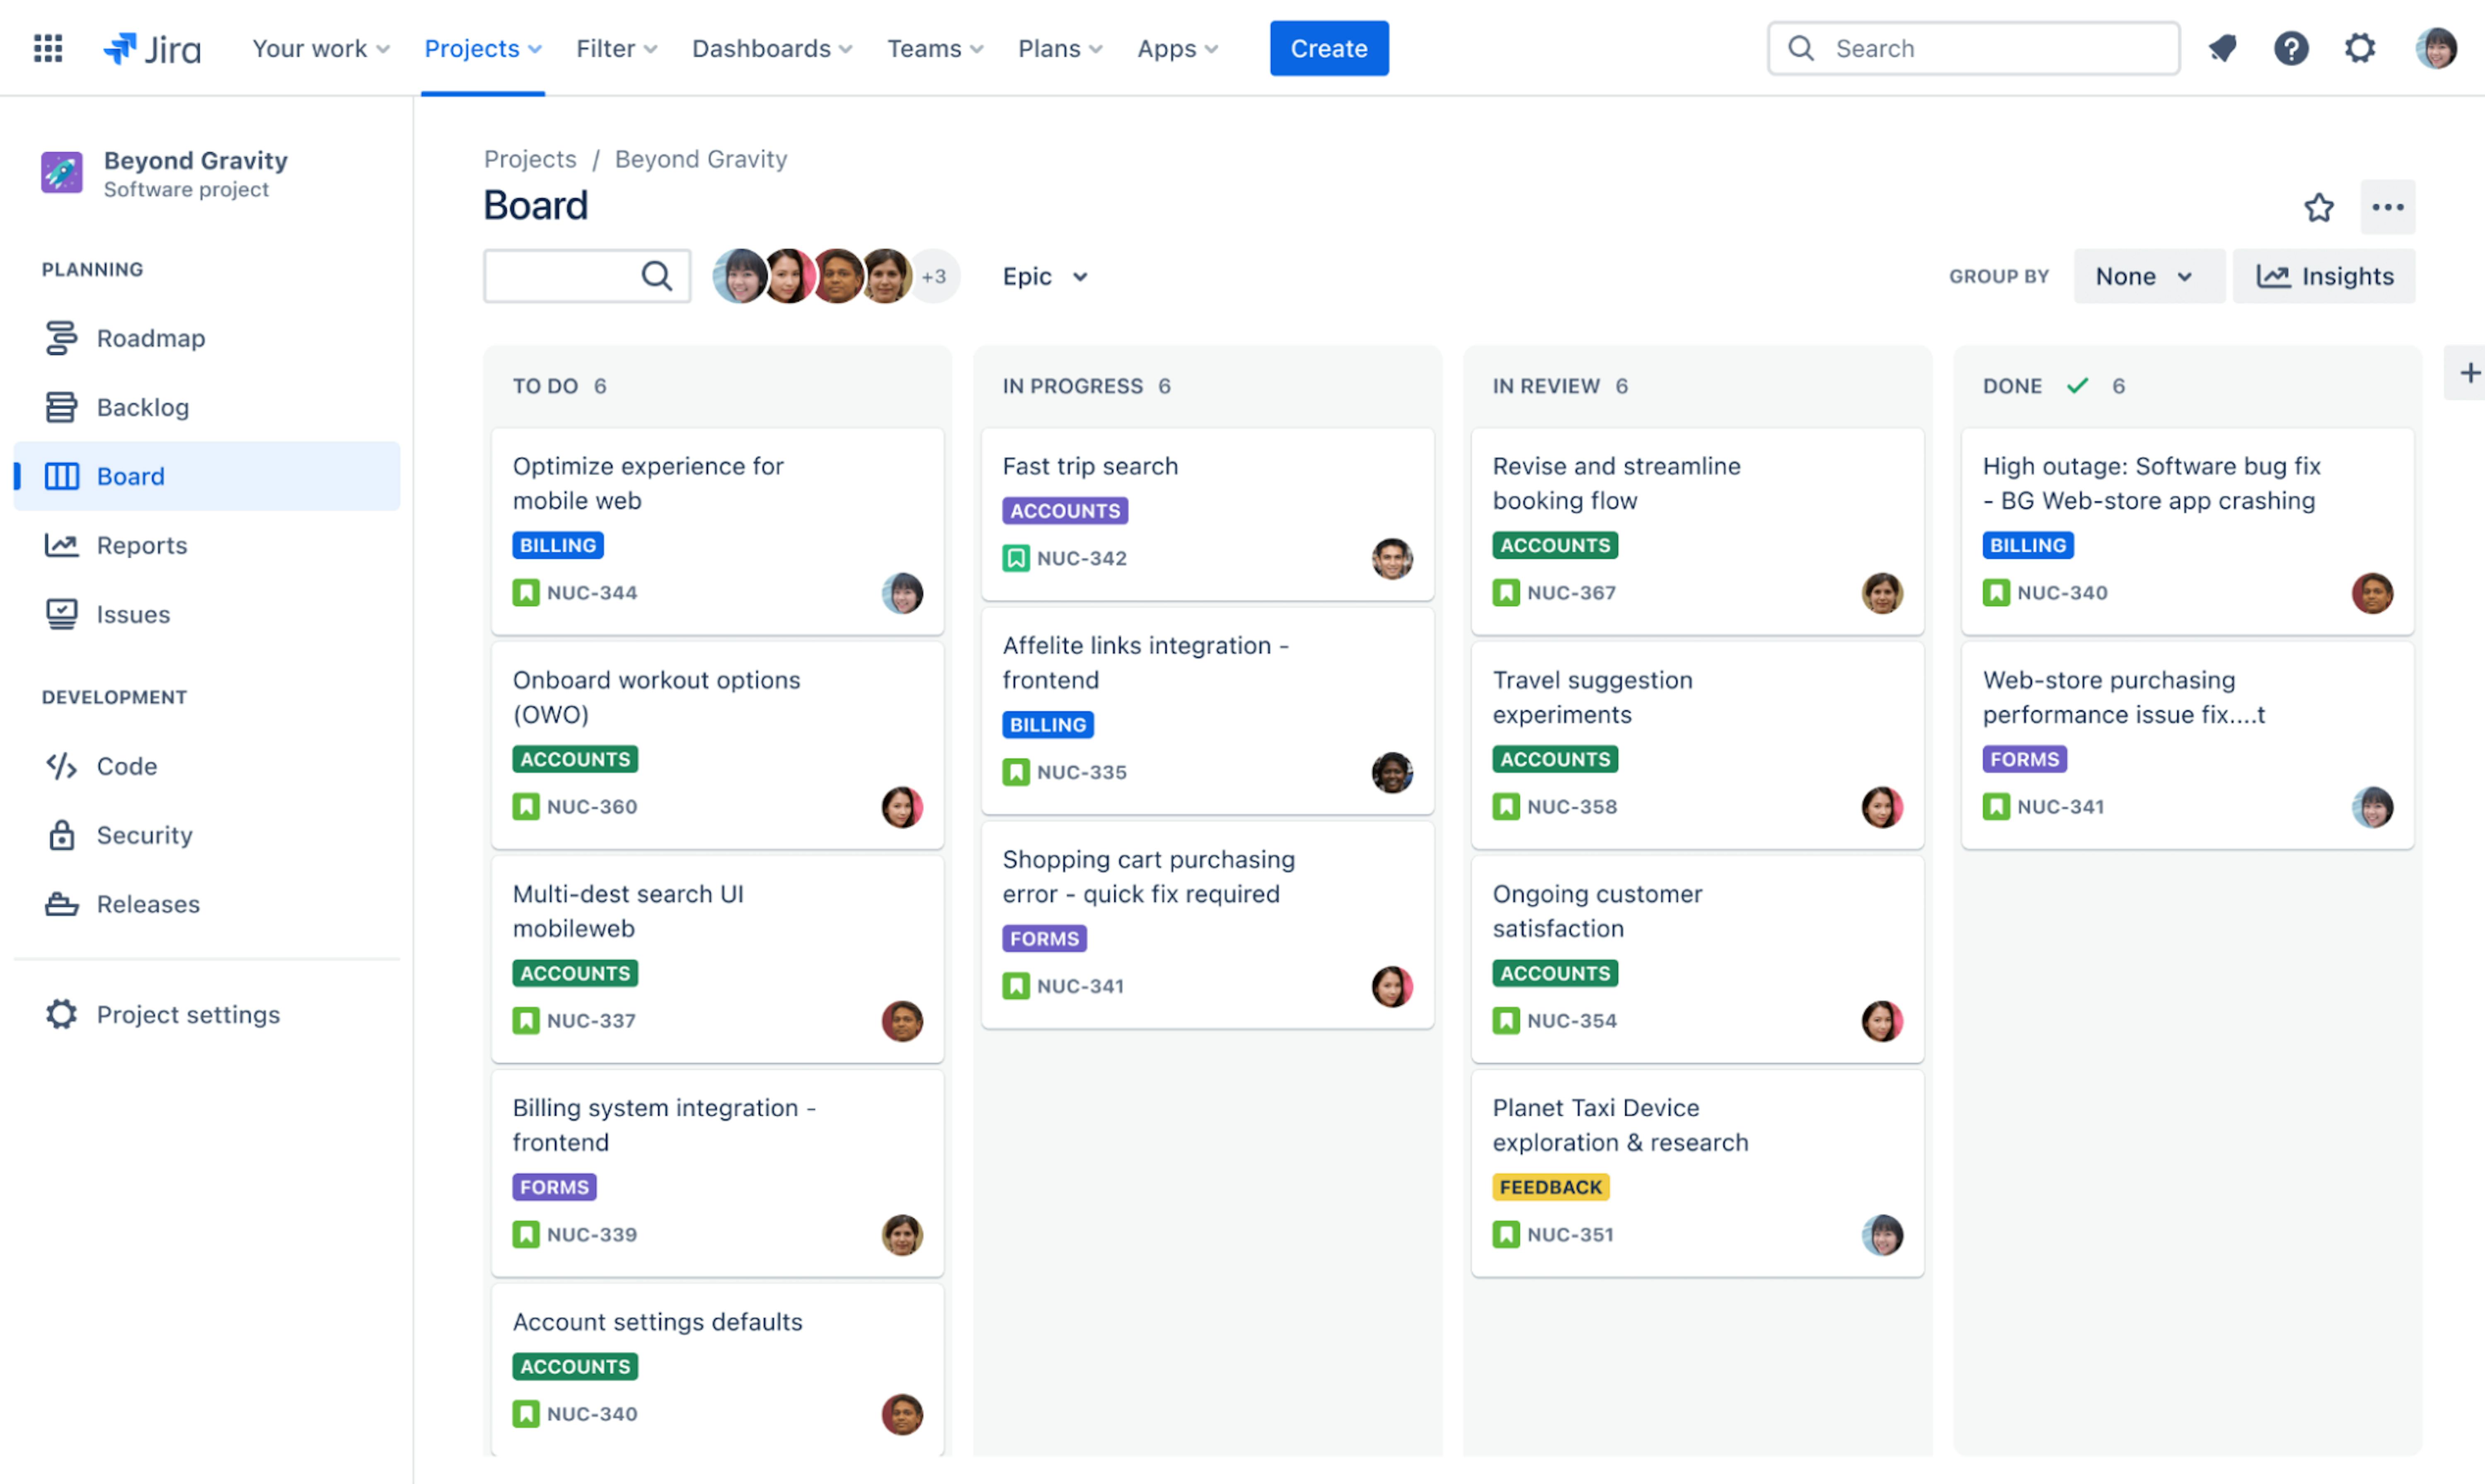
- Sprint burndown charts
- CI/CD pipeline dashboards
An advantage of these and other radiators is that teams can adapt them to define the metrics they need that match their workflow.
At Mad Devs, we use radiators to track business metrics and design them as tools that fit our workflows and the specifics of a given project and the business as a whole.
Marketing radiator
The marketing team uses its radiator to display data on the effectiveness of current marketing strategies. The marketing radiator monitors website traffic and its fluctuations to help the team detect and analyze the factors that influence traffic. For example, the team can observe how a single blog post or publication affects the number of website visitors.

Website traffic is one metric displayed on the radiator. Others include:
- Number of visitors to the website
- Traffic value fluctuations within a specific period
- Top countries of visitors
- Devices used to visit the website
- Best performing pages
- Best performing posts
The marketing radiator provides the team with all the data it needs to keep the website at the top of searches, attract leads, and inform the world about Mad Devs.
Project-specific radiators
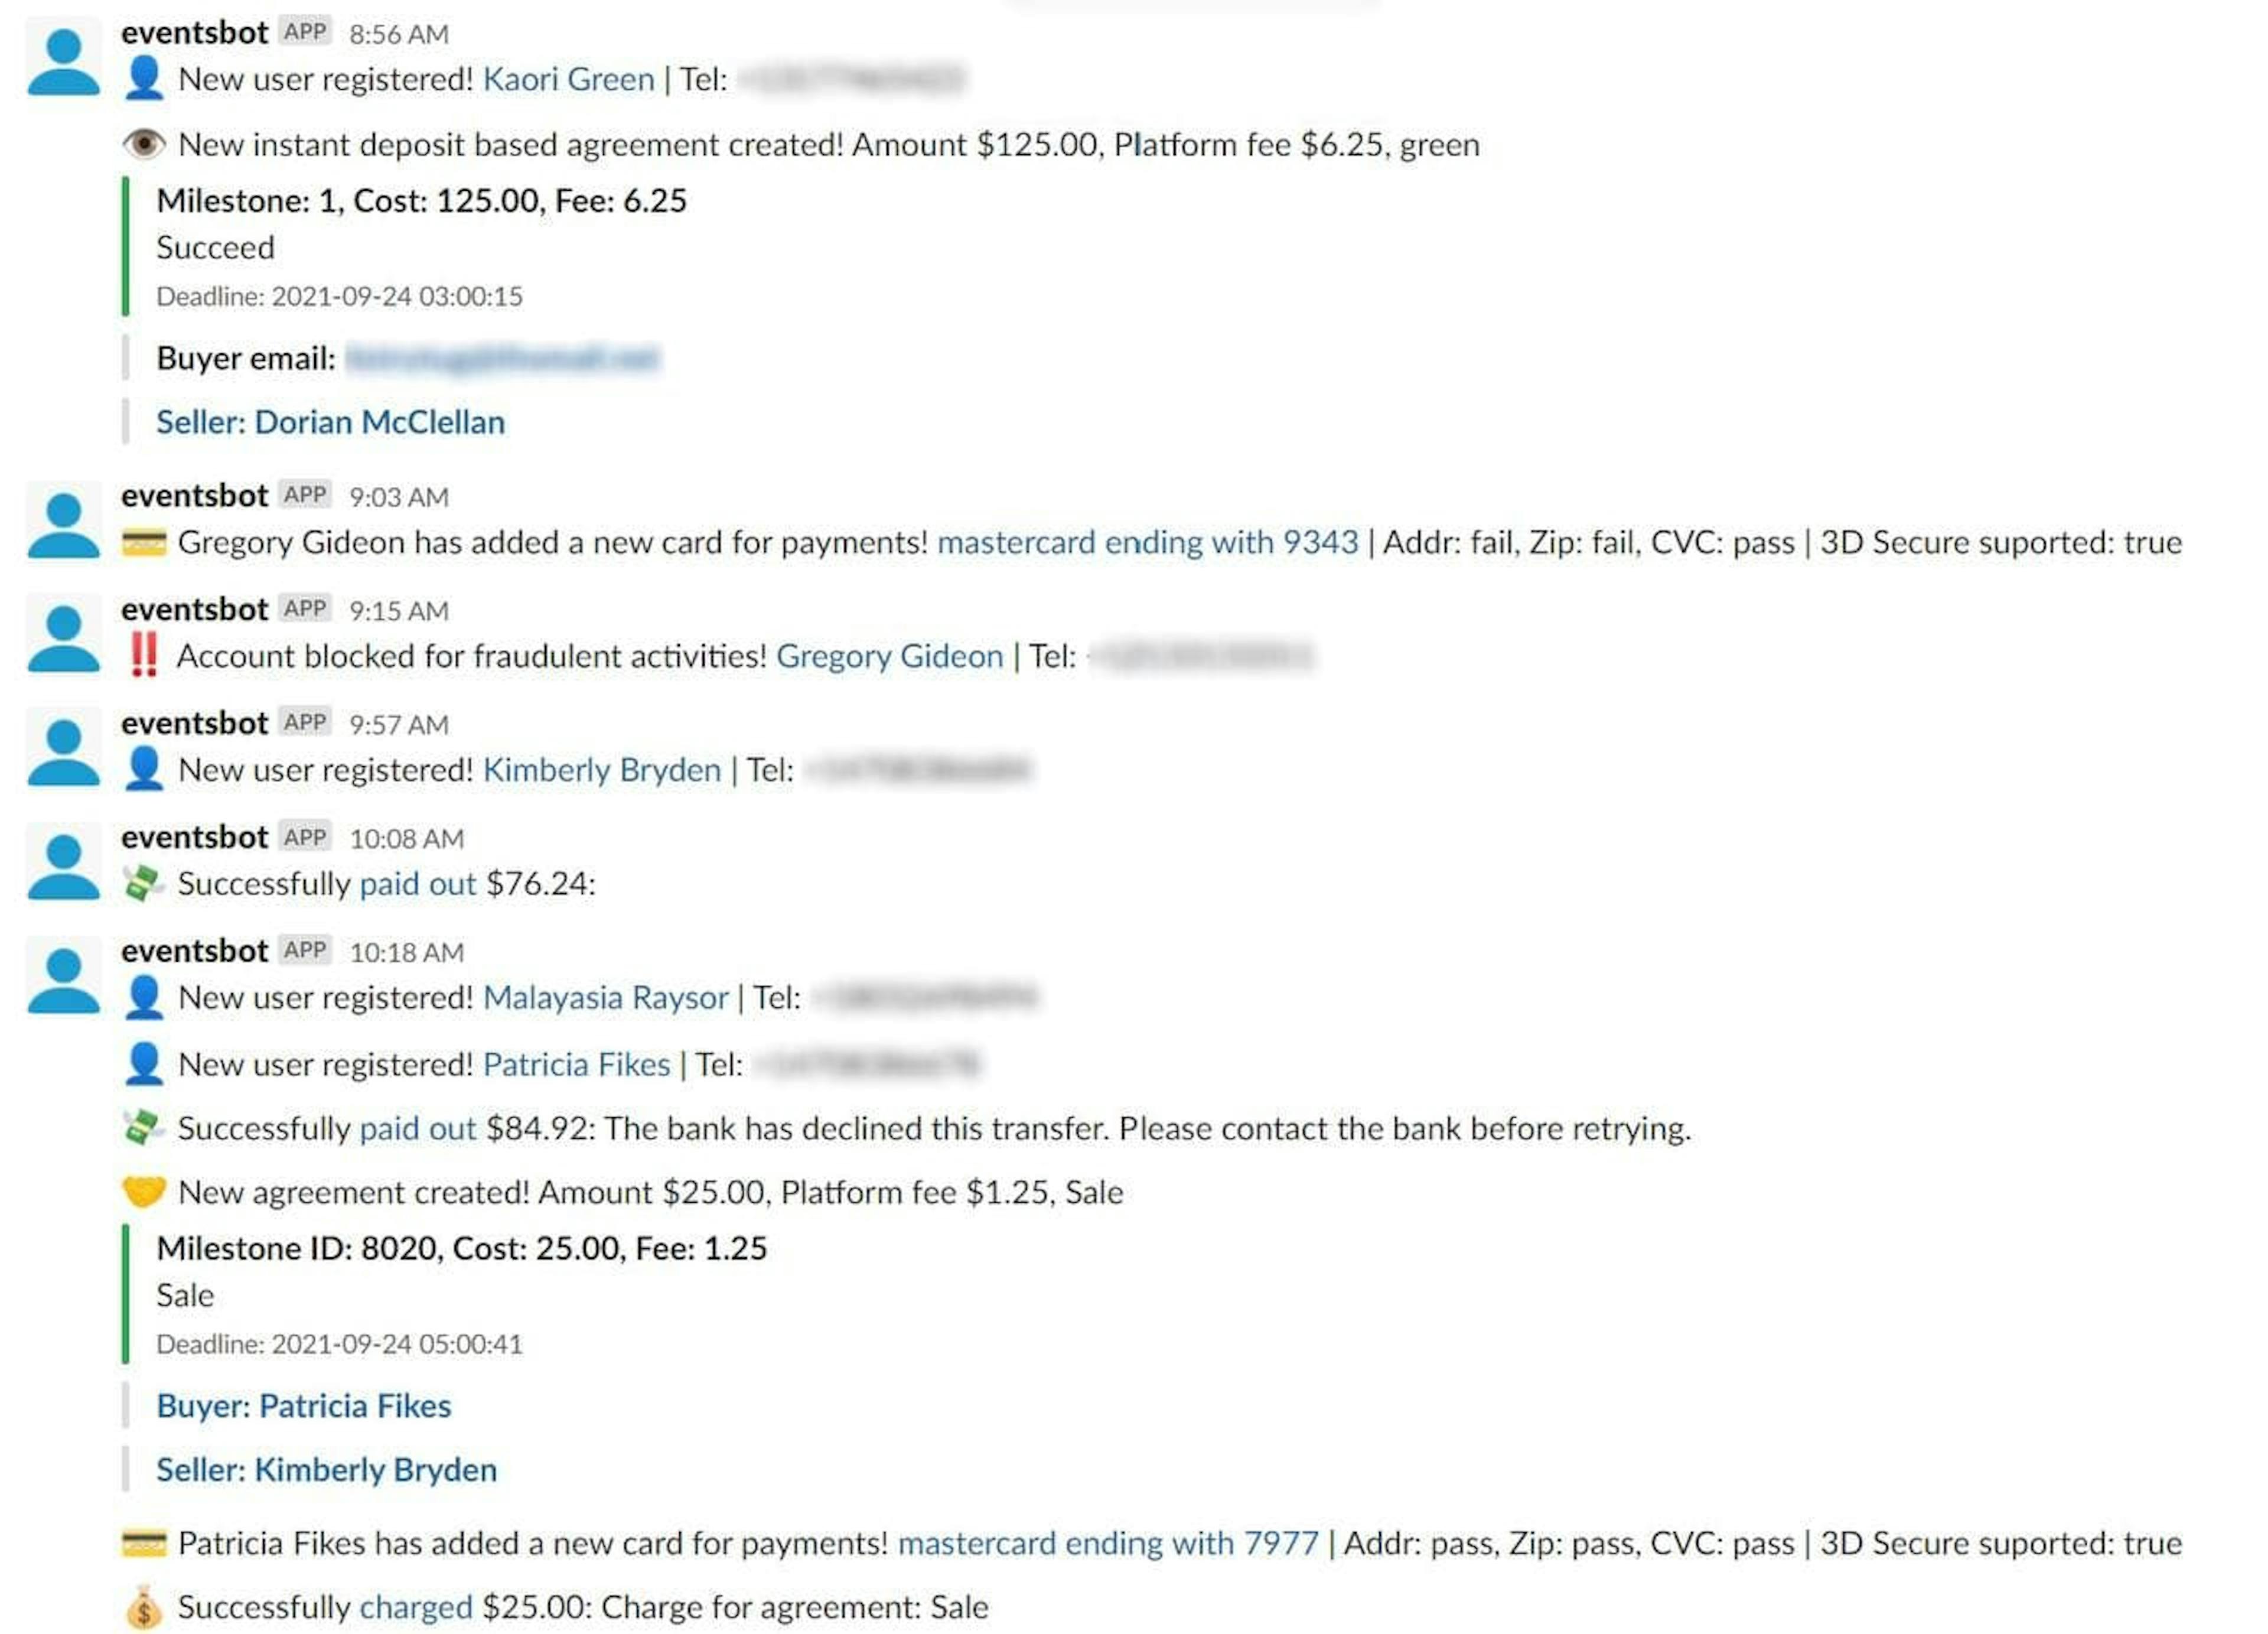
Teams working on specific projects apply radiators attuned to the product or service they are creating. For example, if a team is working on a payment solution, their radiator will display data such as this:
- Number of people using a specific payment method
- Turnaround for a specific period
- Names of buyers and sellers if any goods and services have been sold
Here is an example of a radiator connected to a solution for the transportation industry:
- Number of drivers using the app
- Number of passengers using the app
- Route metrics
The idea behind using a radiator is to get information that shows us whether our efforts are correct and whether we are moving in the right direction.
Has the team implemented a new feature, and it caused a sudden drop in the number of users? It might mean that the feature doesn't work as it is supposed to or something important was missed. It helps us to react on time and make the needed changes to improve the situation.
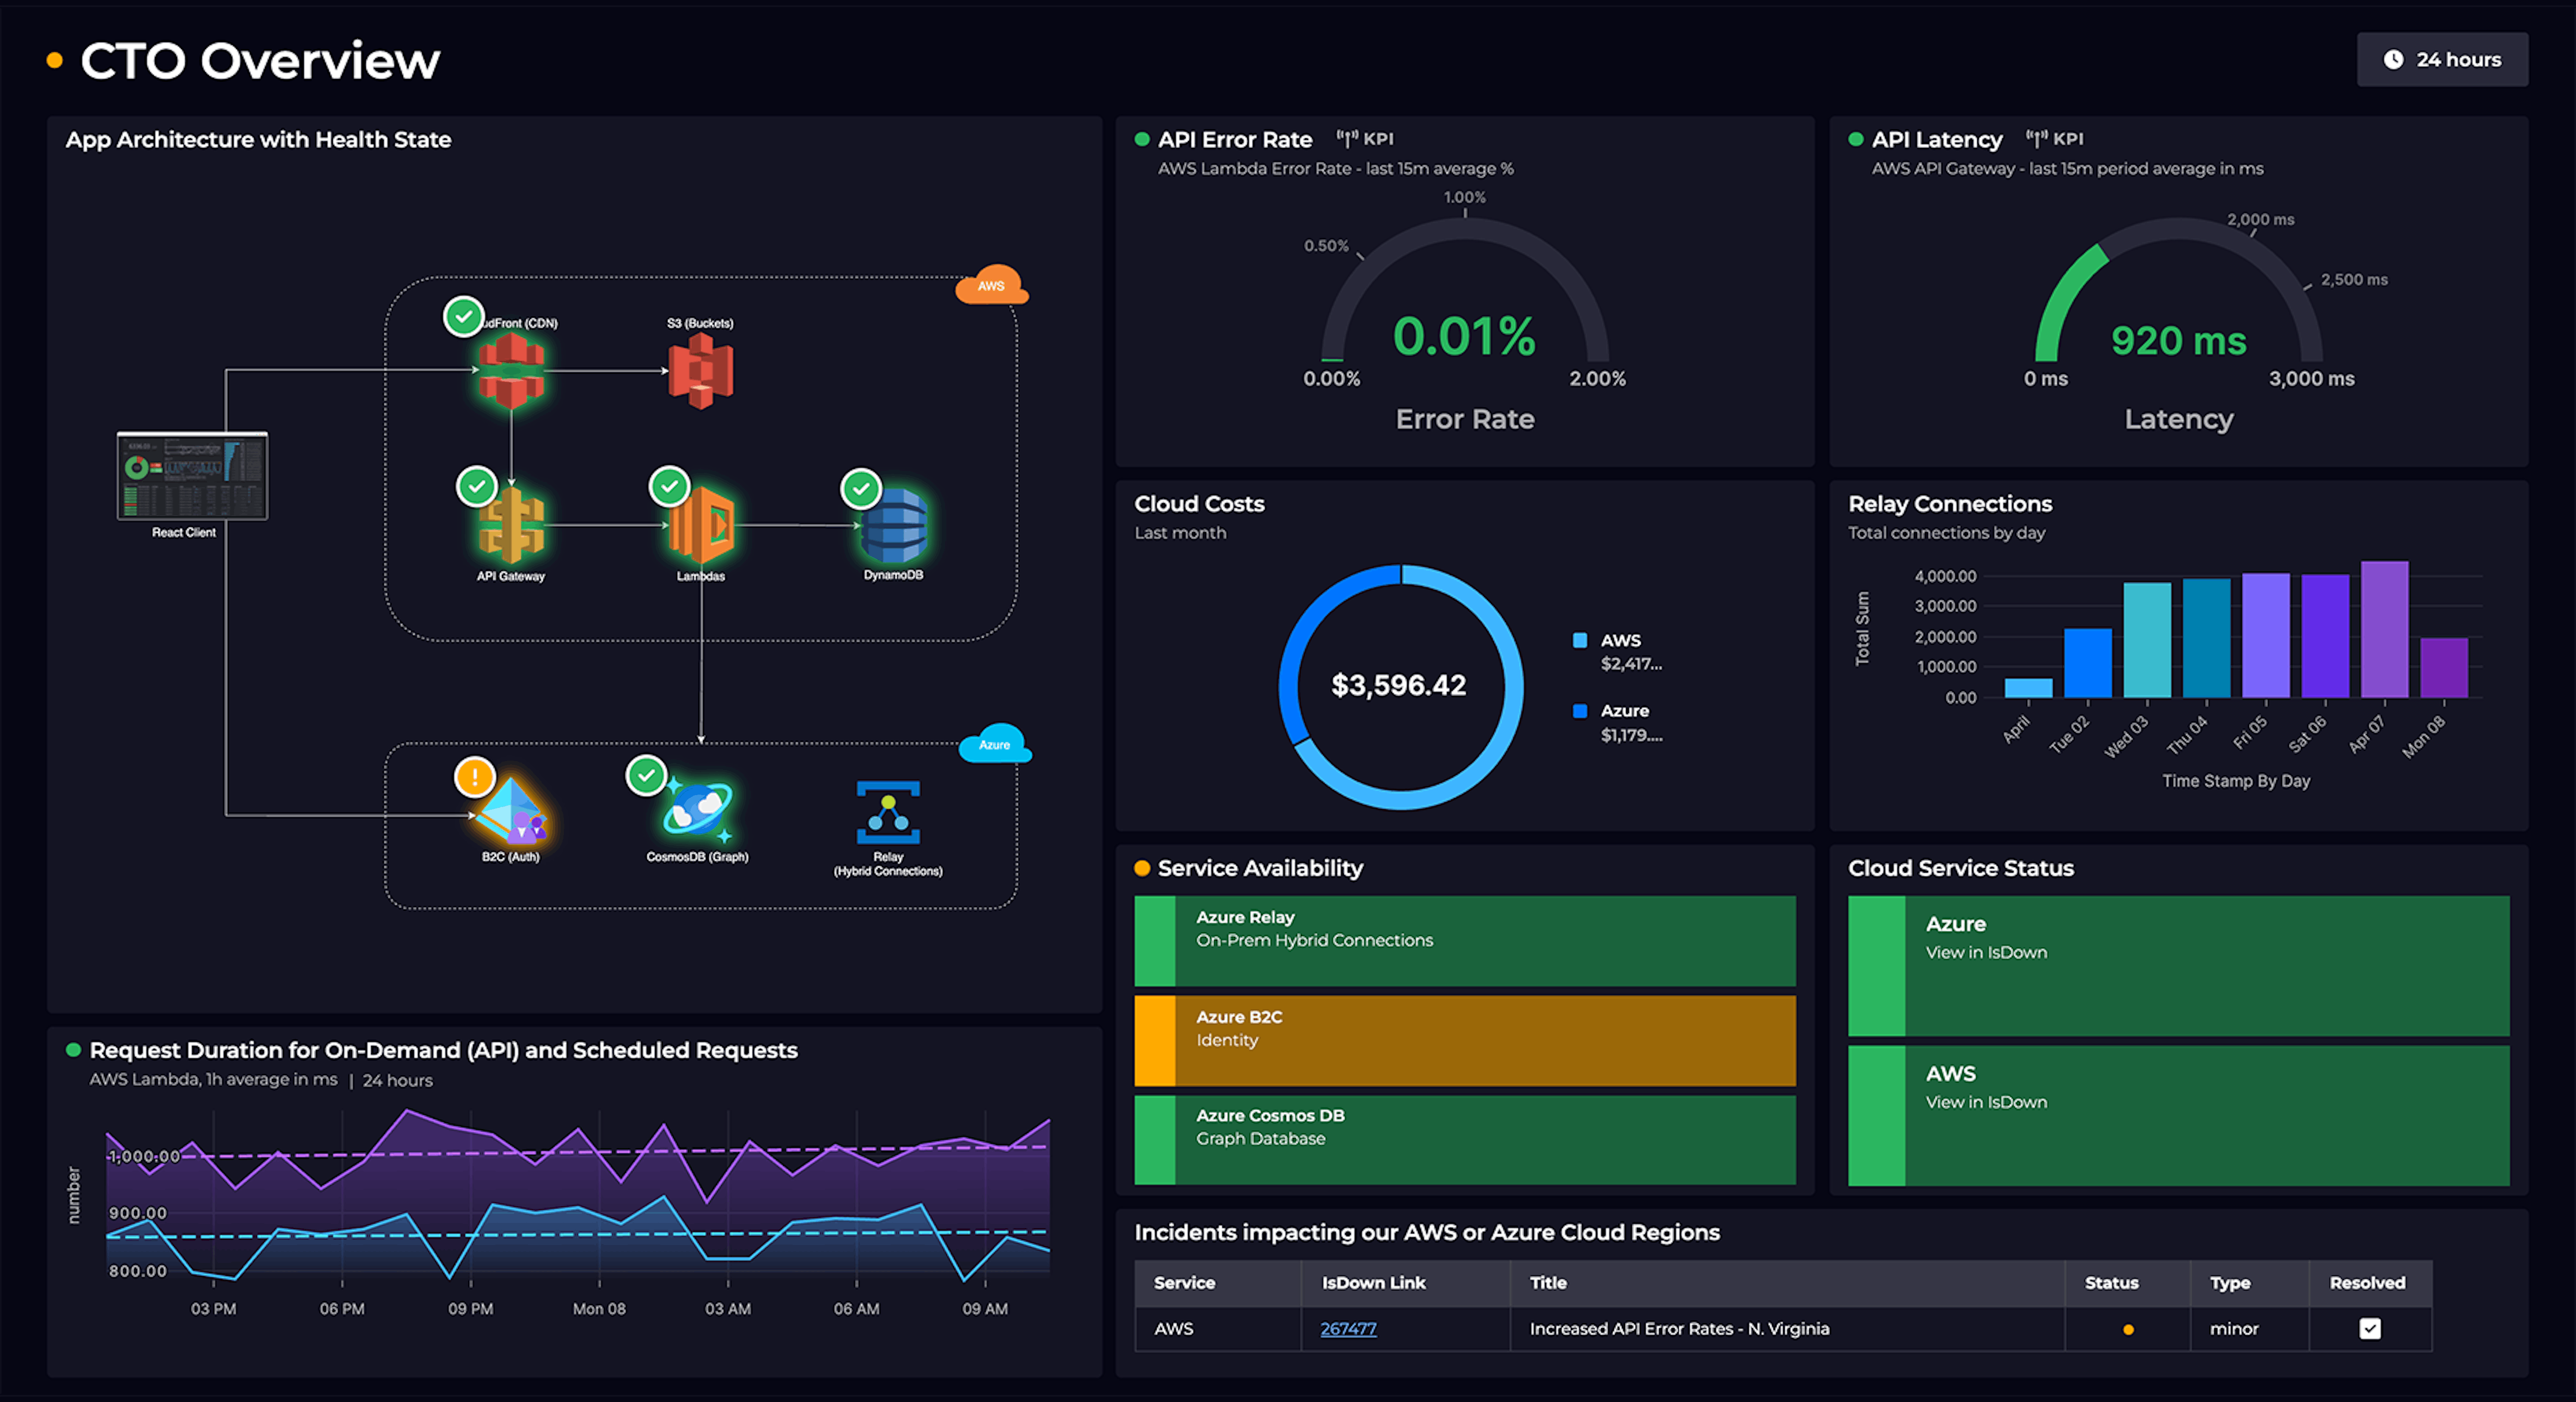
Technical metrics
Together with business metrics, it is critical for engineering teams to see the technical and coding metrics mentioned earlier. There are two reasons for this. Firstly, it allows this to react to poor performance quickly. Secondly, it is helpful for developers to see real users engaging with their product.
Metrics for testing
One such radiator concerns test metrics to assess product quality. The specific metrics differ depending on the project; however, the Mad Devs team applies standard approaches and tools to ensure we deliver the expected solution. All Mad Devs' code is covered with tests, meaning we constantly monitor code coverage metrics through our code coverage report:
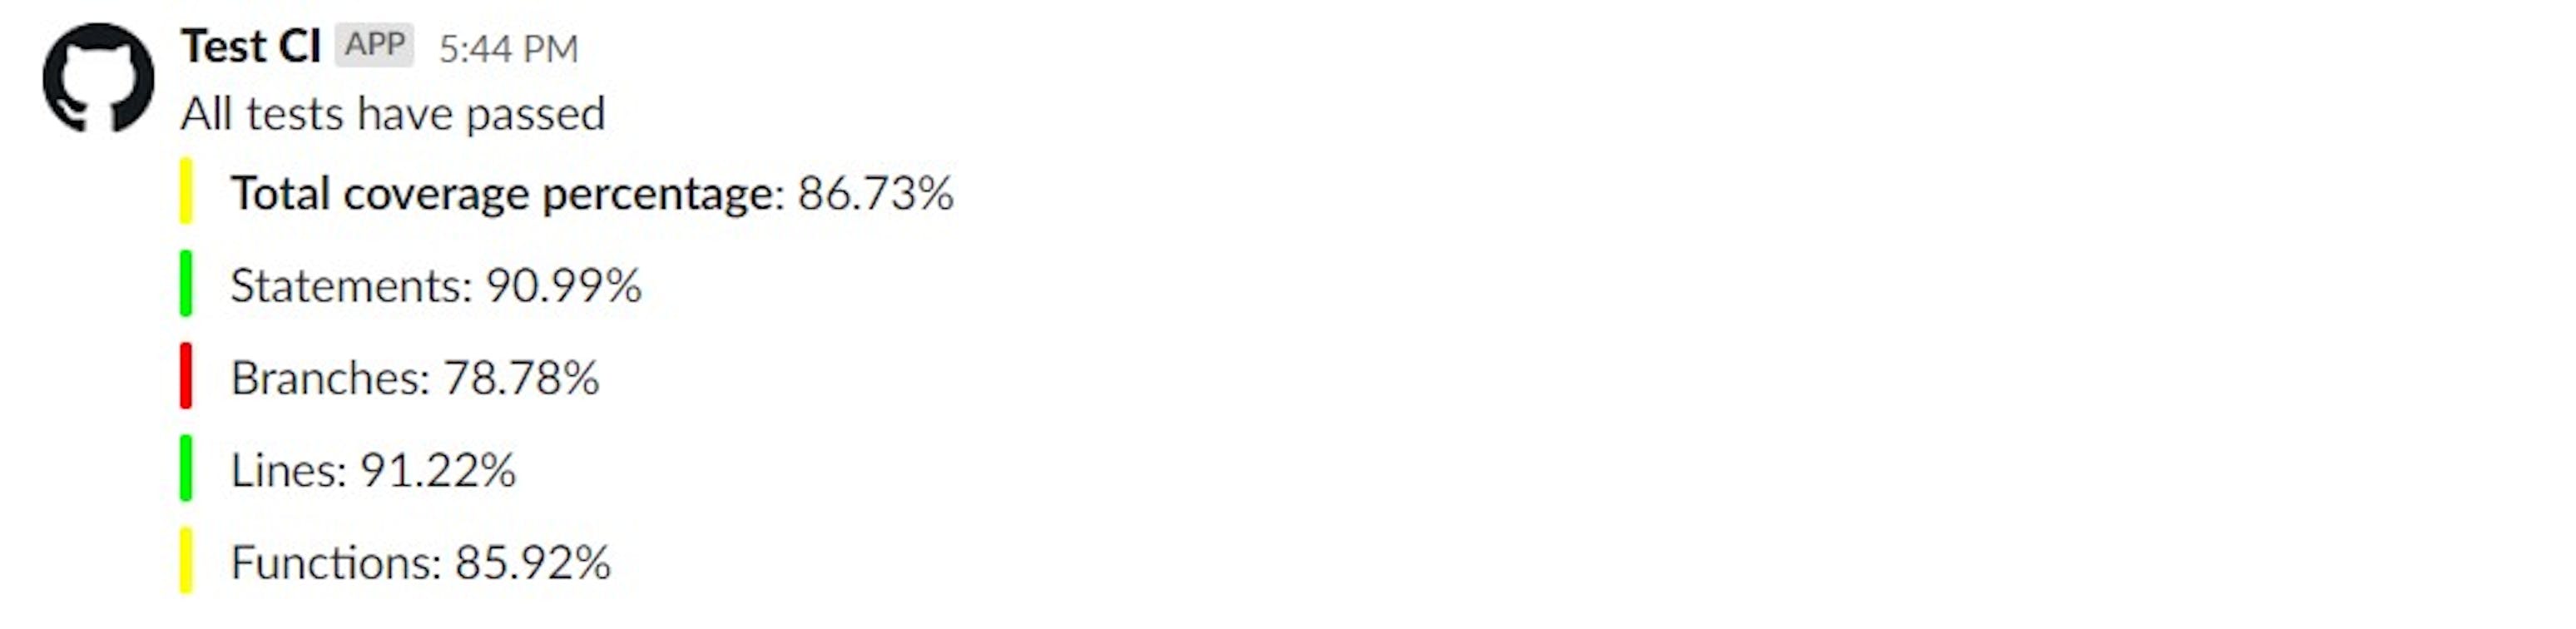
Our teams use this information to check:
- If all tests have passed or not
- The percentage of test coverage
- The number of statements in the program that have been executed
- The number of branches of the control structures that have been executed
- The number of branches in the control structure that have been executed
- The number of lines of source code that have been tested
- The number of defined functions that have been called
This data provides enough context to understand whether testing was successful and where improvements to the code are needed.
Lighthouse radiator
Our project teams that work on webpages use Google Lighthouse to track the quality of the pages. They audit them for performance, accessibility, SEO, and more. To provide constant updates on these aspects, the teams use a script that runs the page through Lighthouse and delivers a score to a group channel in Slack:
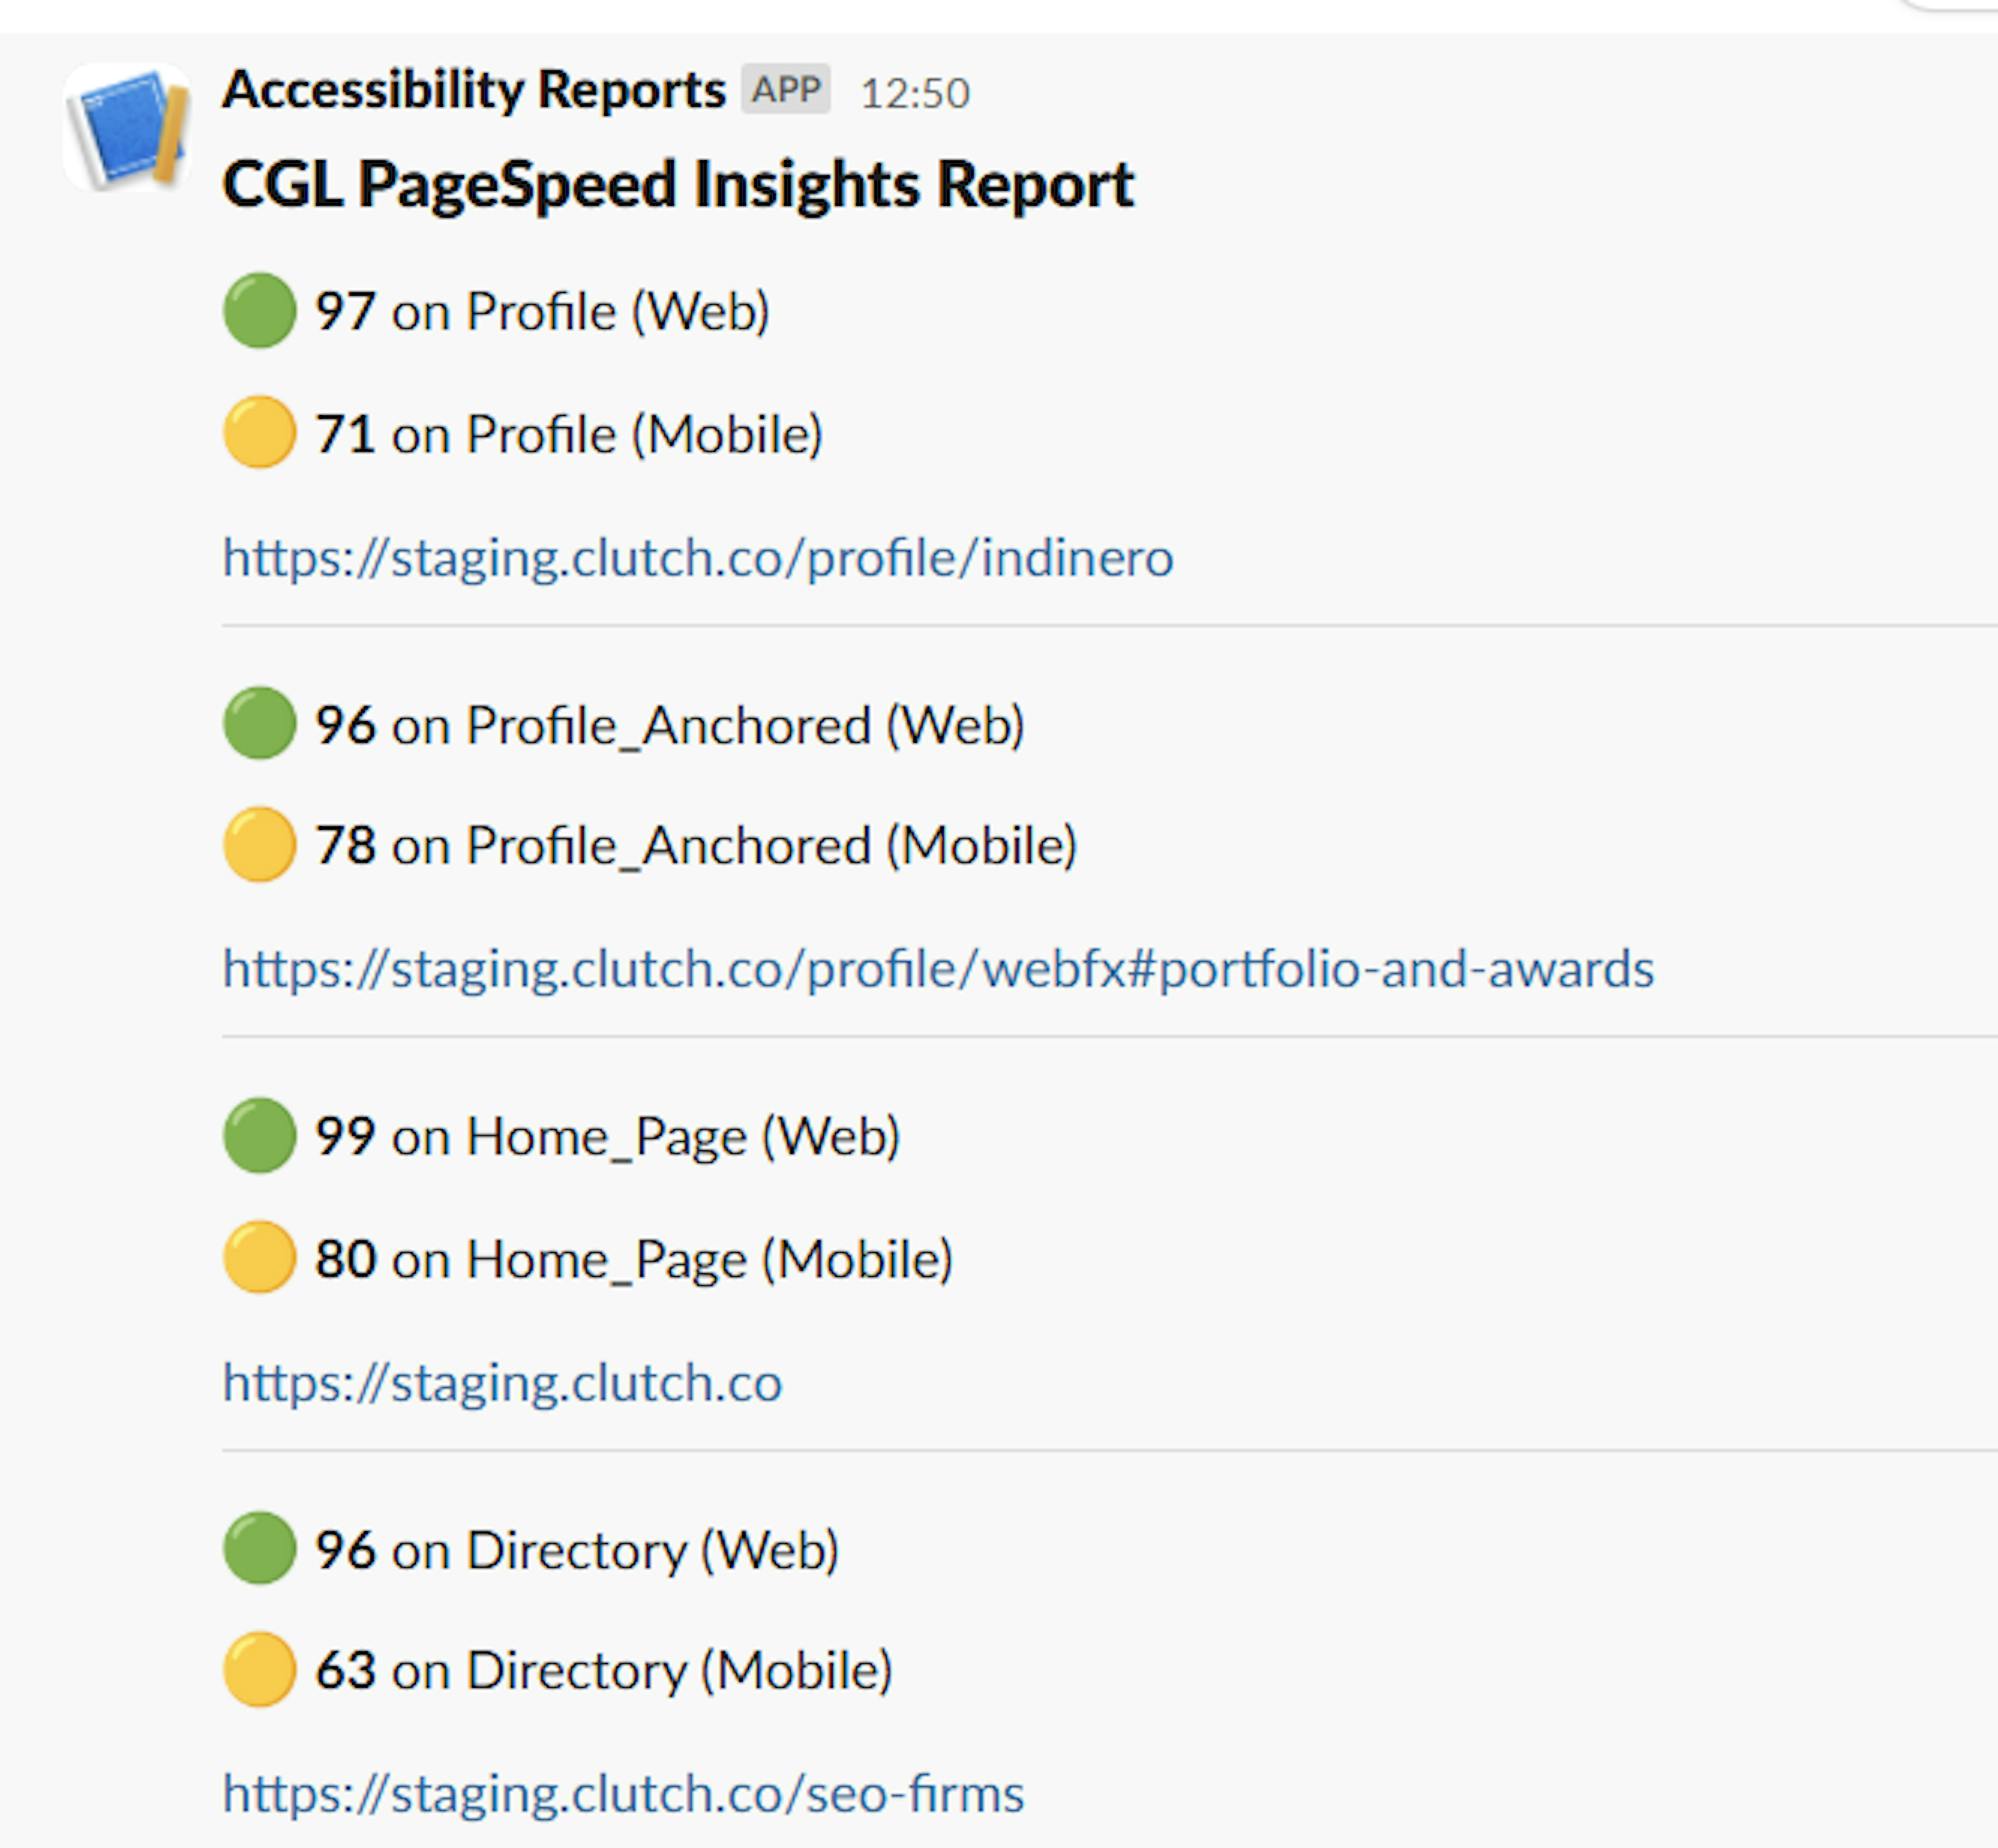
Teams keep track of progress and can react to any significant, negative changes in a short amount of time.
Logging tools: understand the results
Metrics provide essential details to how workflows support or hamper the creation of value, and businesses that use them can reap many benefits. Another aspect of productivity involves looking beyond the raw data on user behavior, resource usage, or any other aspect of a project to find the specific reasons for a low cycle time or higher bug frequency. To do this, Mad Devs uses logging tools.
They show the sequence of events that led to the results shown in metrics. There are many logging tools available. This section will explore our team's favorites: ELK stack and DataDog.
ELK
This is an acronym that refers to three projects: Elasticsearch, Logstash, and Kibana:
- Elasticsearch is a full-text search and analytics engine.
- Logstash is a log aggregator that collects data from multiple sources, converts it, and sends it to different destinations, e.g. Elasticsearch.
- Kibana provides an interface that enables users to visualize and analyze data via graphs and charts.
ELK is a log management platform that enables users to collect massive volumes of data from anywhere across infrastructure and then search, analyze, and visualize this data in real time.
DataDog
DataDog is a monitoring, security, and analytics platform. At times, our team decides that ELK is not necessary for a particular project, so they only use DataDog.
Automated alerts to maintain focus
While metrics and logs are important, it is difficult to check them constantly. In the end, we want to concentrate on our work. On the other hand, it's important to learn immediately when something has gone wrong, which is why Mad Devs use alerting tools to quickly react to issues and prevent the accumulation of errors and bugs. Here are the tools our team recommends.
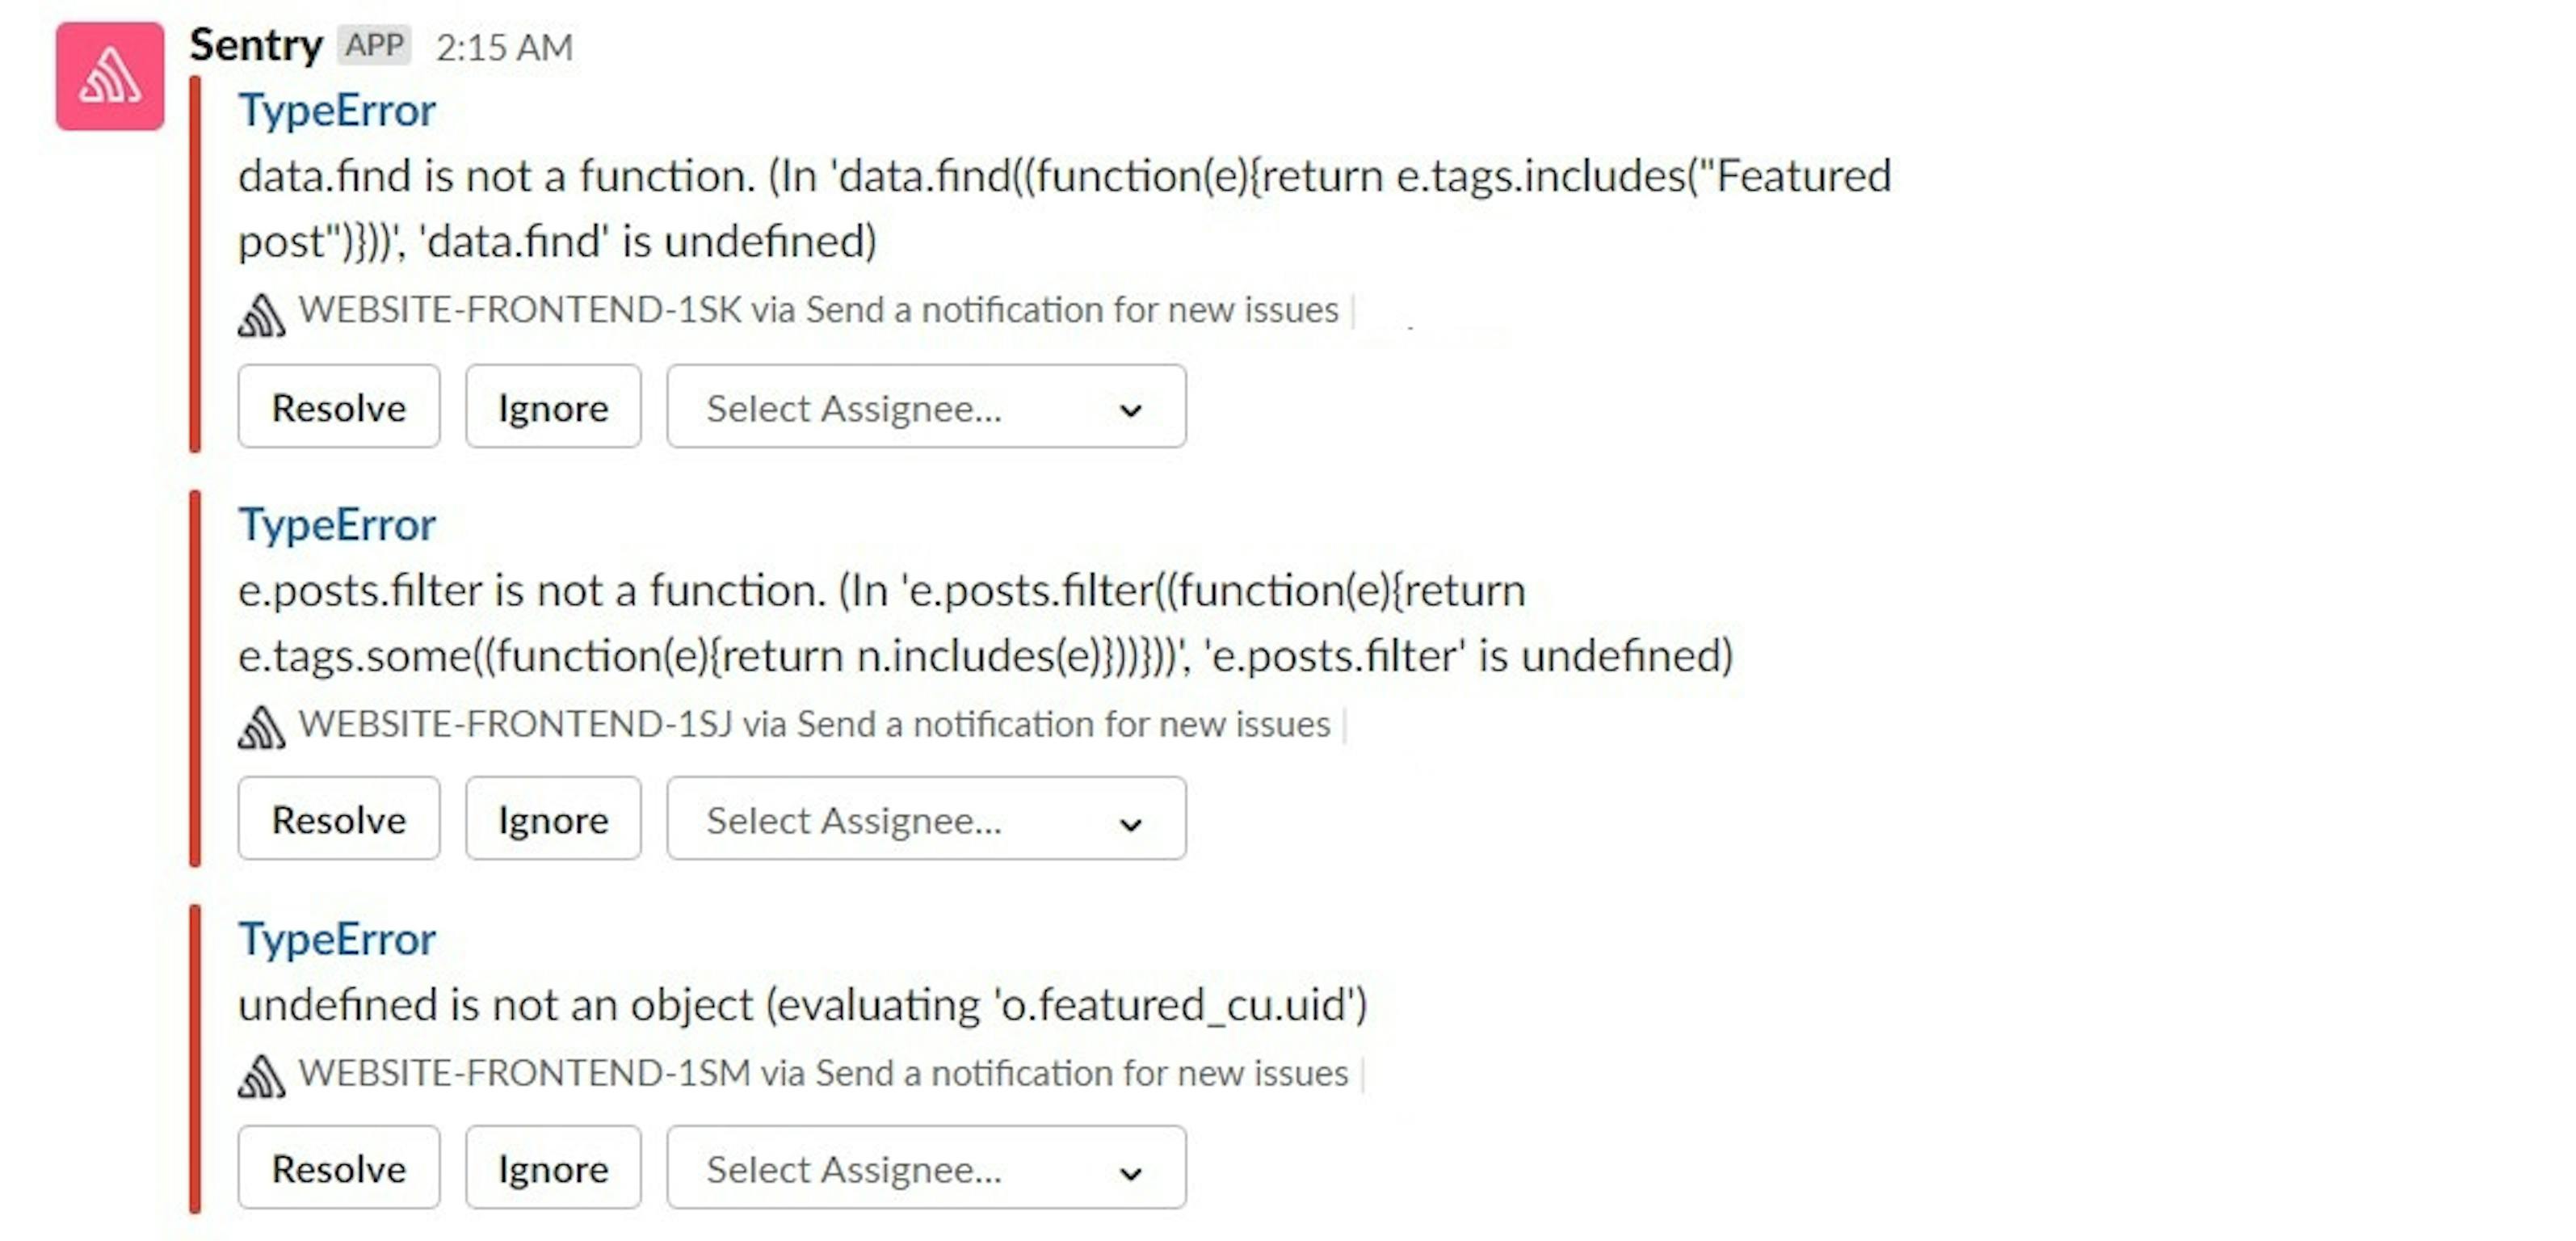
Sentry
Sentry detects various and unique errors in user behavior and provides sufficient information about the bug to fix it, even within a couple of minutes in most cases. More complex issues may require several hours or more.
Uptimerbot
Uptimerbot is a free tool used to monitor the production/staging environment. It sends real-time alerts when production/staging is down and allows our team to fix it as soon as possible. Uptimerbot sends alerts via email, SMS, and Slack.
GitLab Events Integration
Gitlab Events Integration monitors for CI/CD job failures, performance issues, and deployment status. Our team receives alerts in a Slack channel, which allows them to take action immediately.
Prometheus
Prometheus is not just a tool. It is a monitoring system that records real-time metrics in a time series database. It can be set up to send alerts when a specific condition is maintained during a preset period. The alerts are sent to Alertmanager.
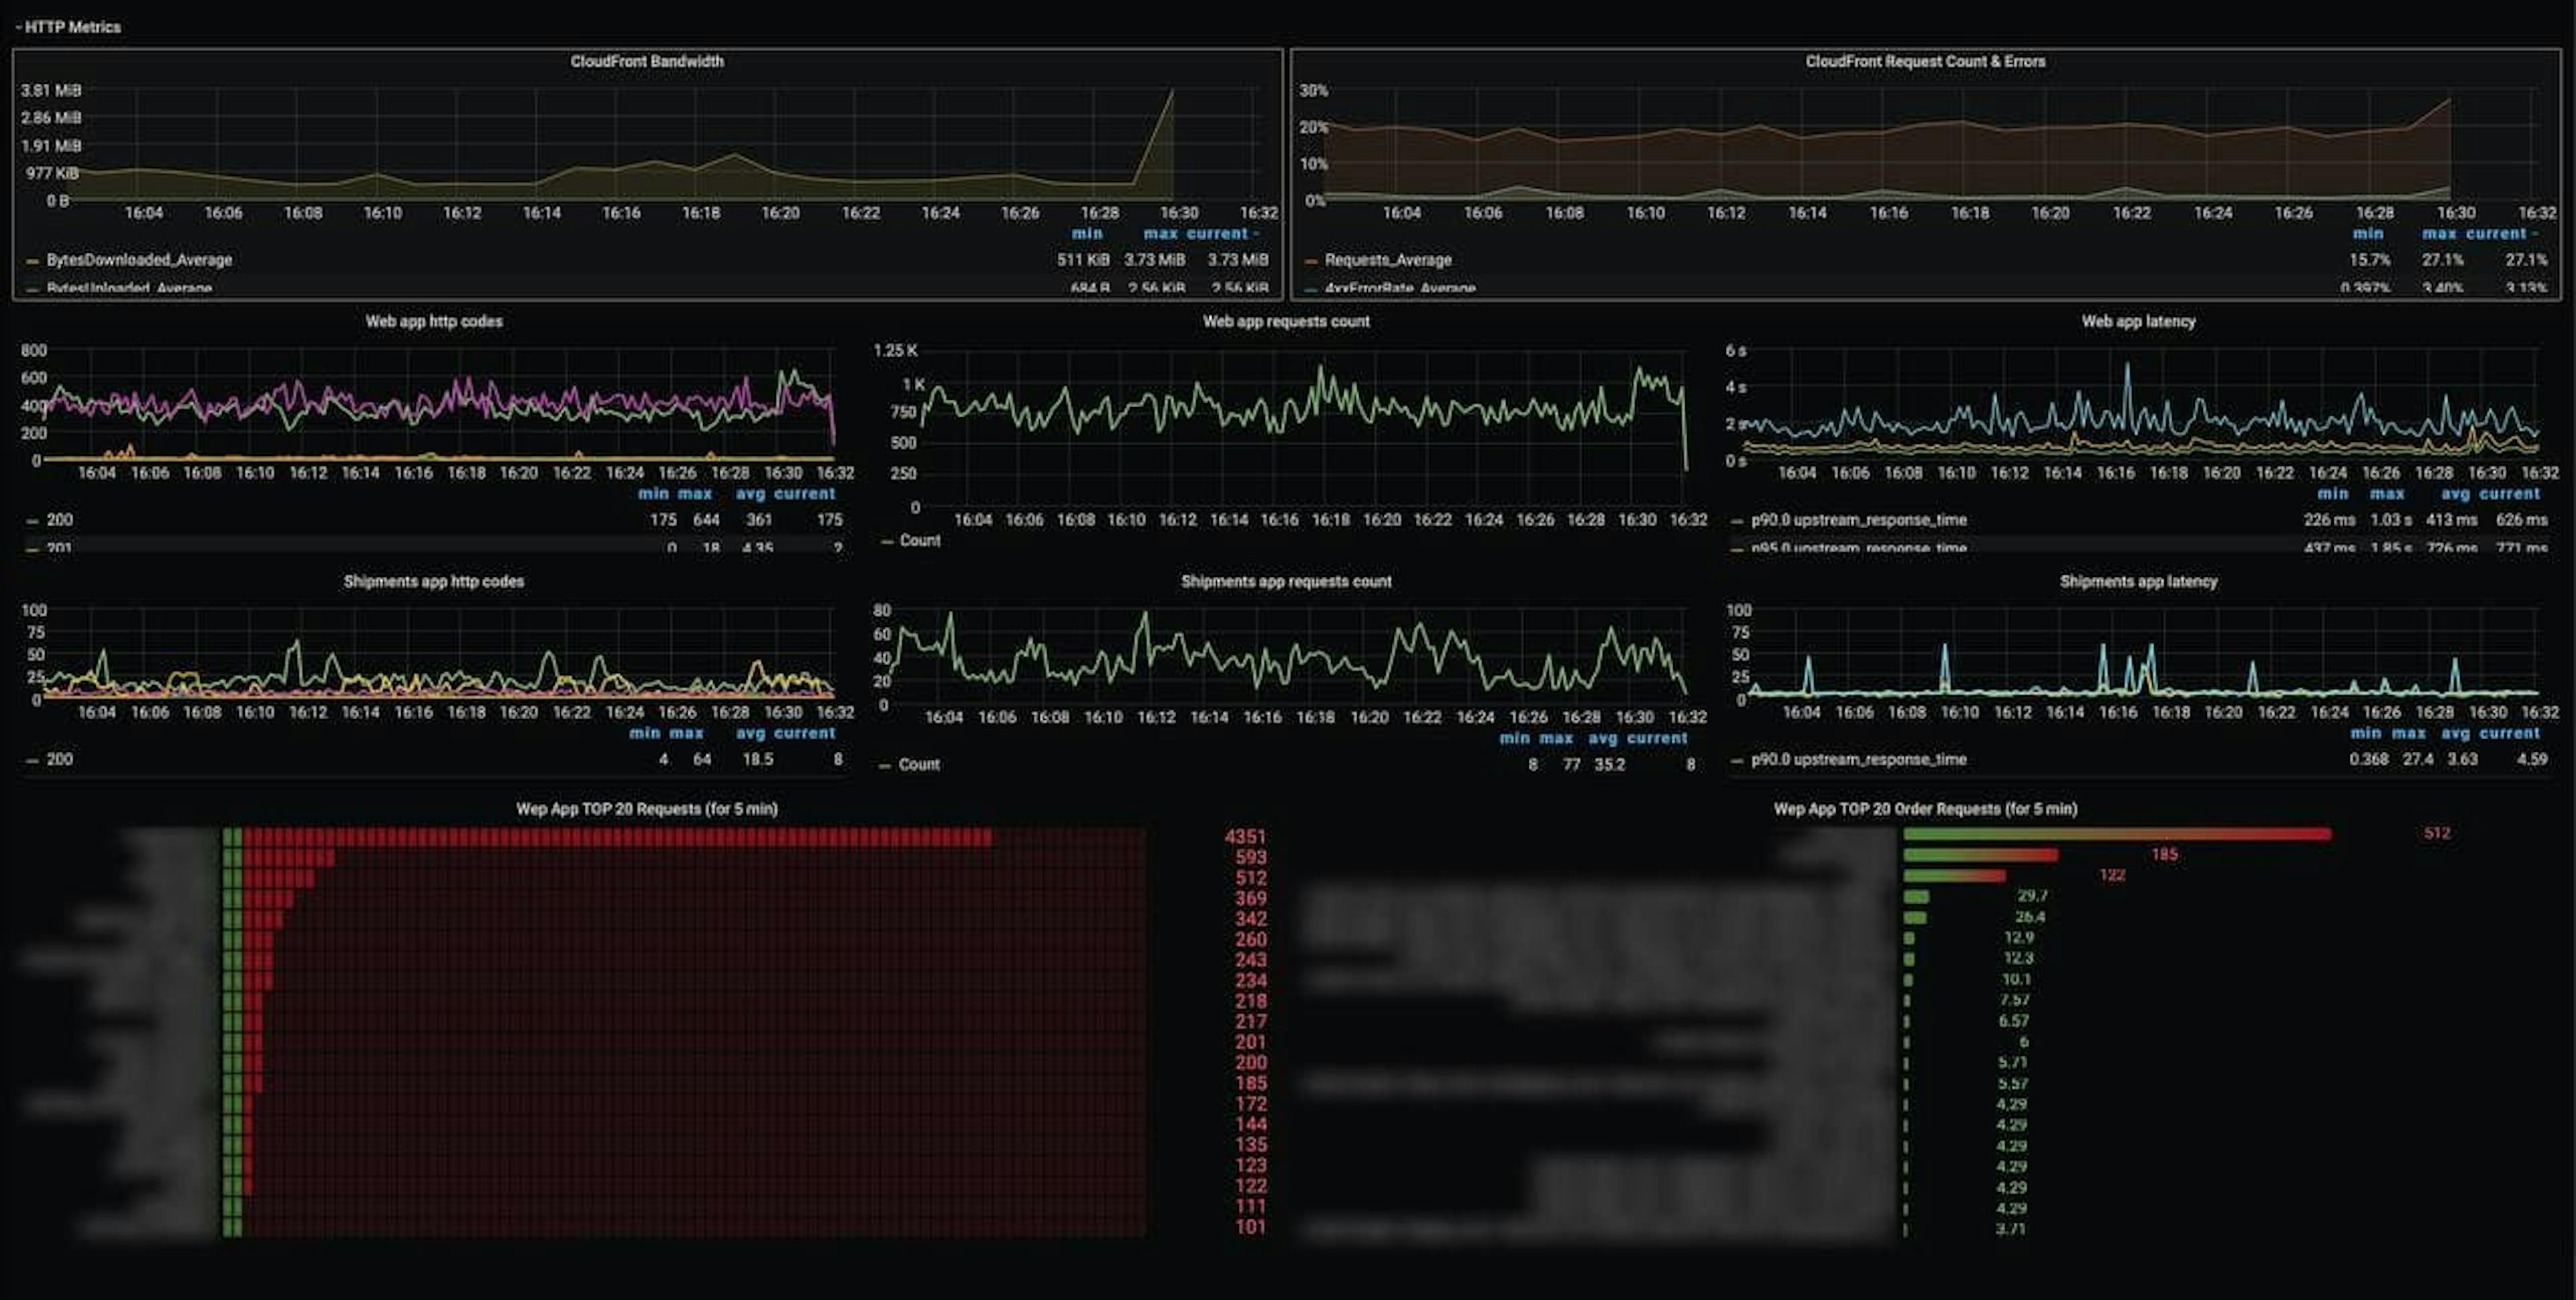
Grafana
We use Grafana to visualize the metrics provided by Prometheus. While the latter sends metrics in the form of numbers, Grafana turns these metrics into graphs and models. These visuals allow our team to track the project's progress, regression, and to build hypotheses.
Alert Manager
We use this tool to receive alerts sent by client applications. When Alertmanager receives an alert from Prometheus, it chooses whether to silence it or forward it to the right team. The Alertmanager debugs and groups alerts and sends them to the correct receiver integration:
- OpsGenie
- PagerDuty
Considering the tool's convenience, it is not surprising that Mad Devs uses it in all of its projects.
The importance of metrics
The amount of data that teams produce is growing, and while it can be a challenge to collect and analyze it, ignoring the benefits monitoring brings is a devastating choice. If a team doesn't use any metrics, monitoring, alerting, and logging, there will be no means of knowing when production and staging are down, and bugs will accumulate to the degree that developers, managers, and customers will become frustrated and dissatisfied.
Mad Devs applies all the necessary tools to give clients a clear picture of a project team's productivity and create high-quality products and services.


