The burndown chart in Jira is a powerful tool that helps visualize and calculate tasks within a sprint. Using it allows you to make the best decisions and draw the most valuable conclusions in all sprint phases, from planning to processing and completion. However, there are many nuances to consider when using this tool. And in this article we will help you to understand them. So, please enjoy reading.
What is burndown chart?
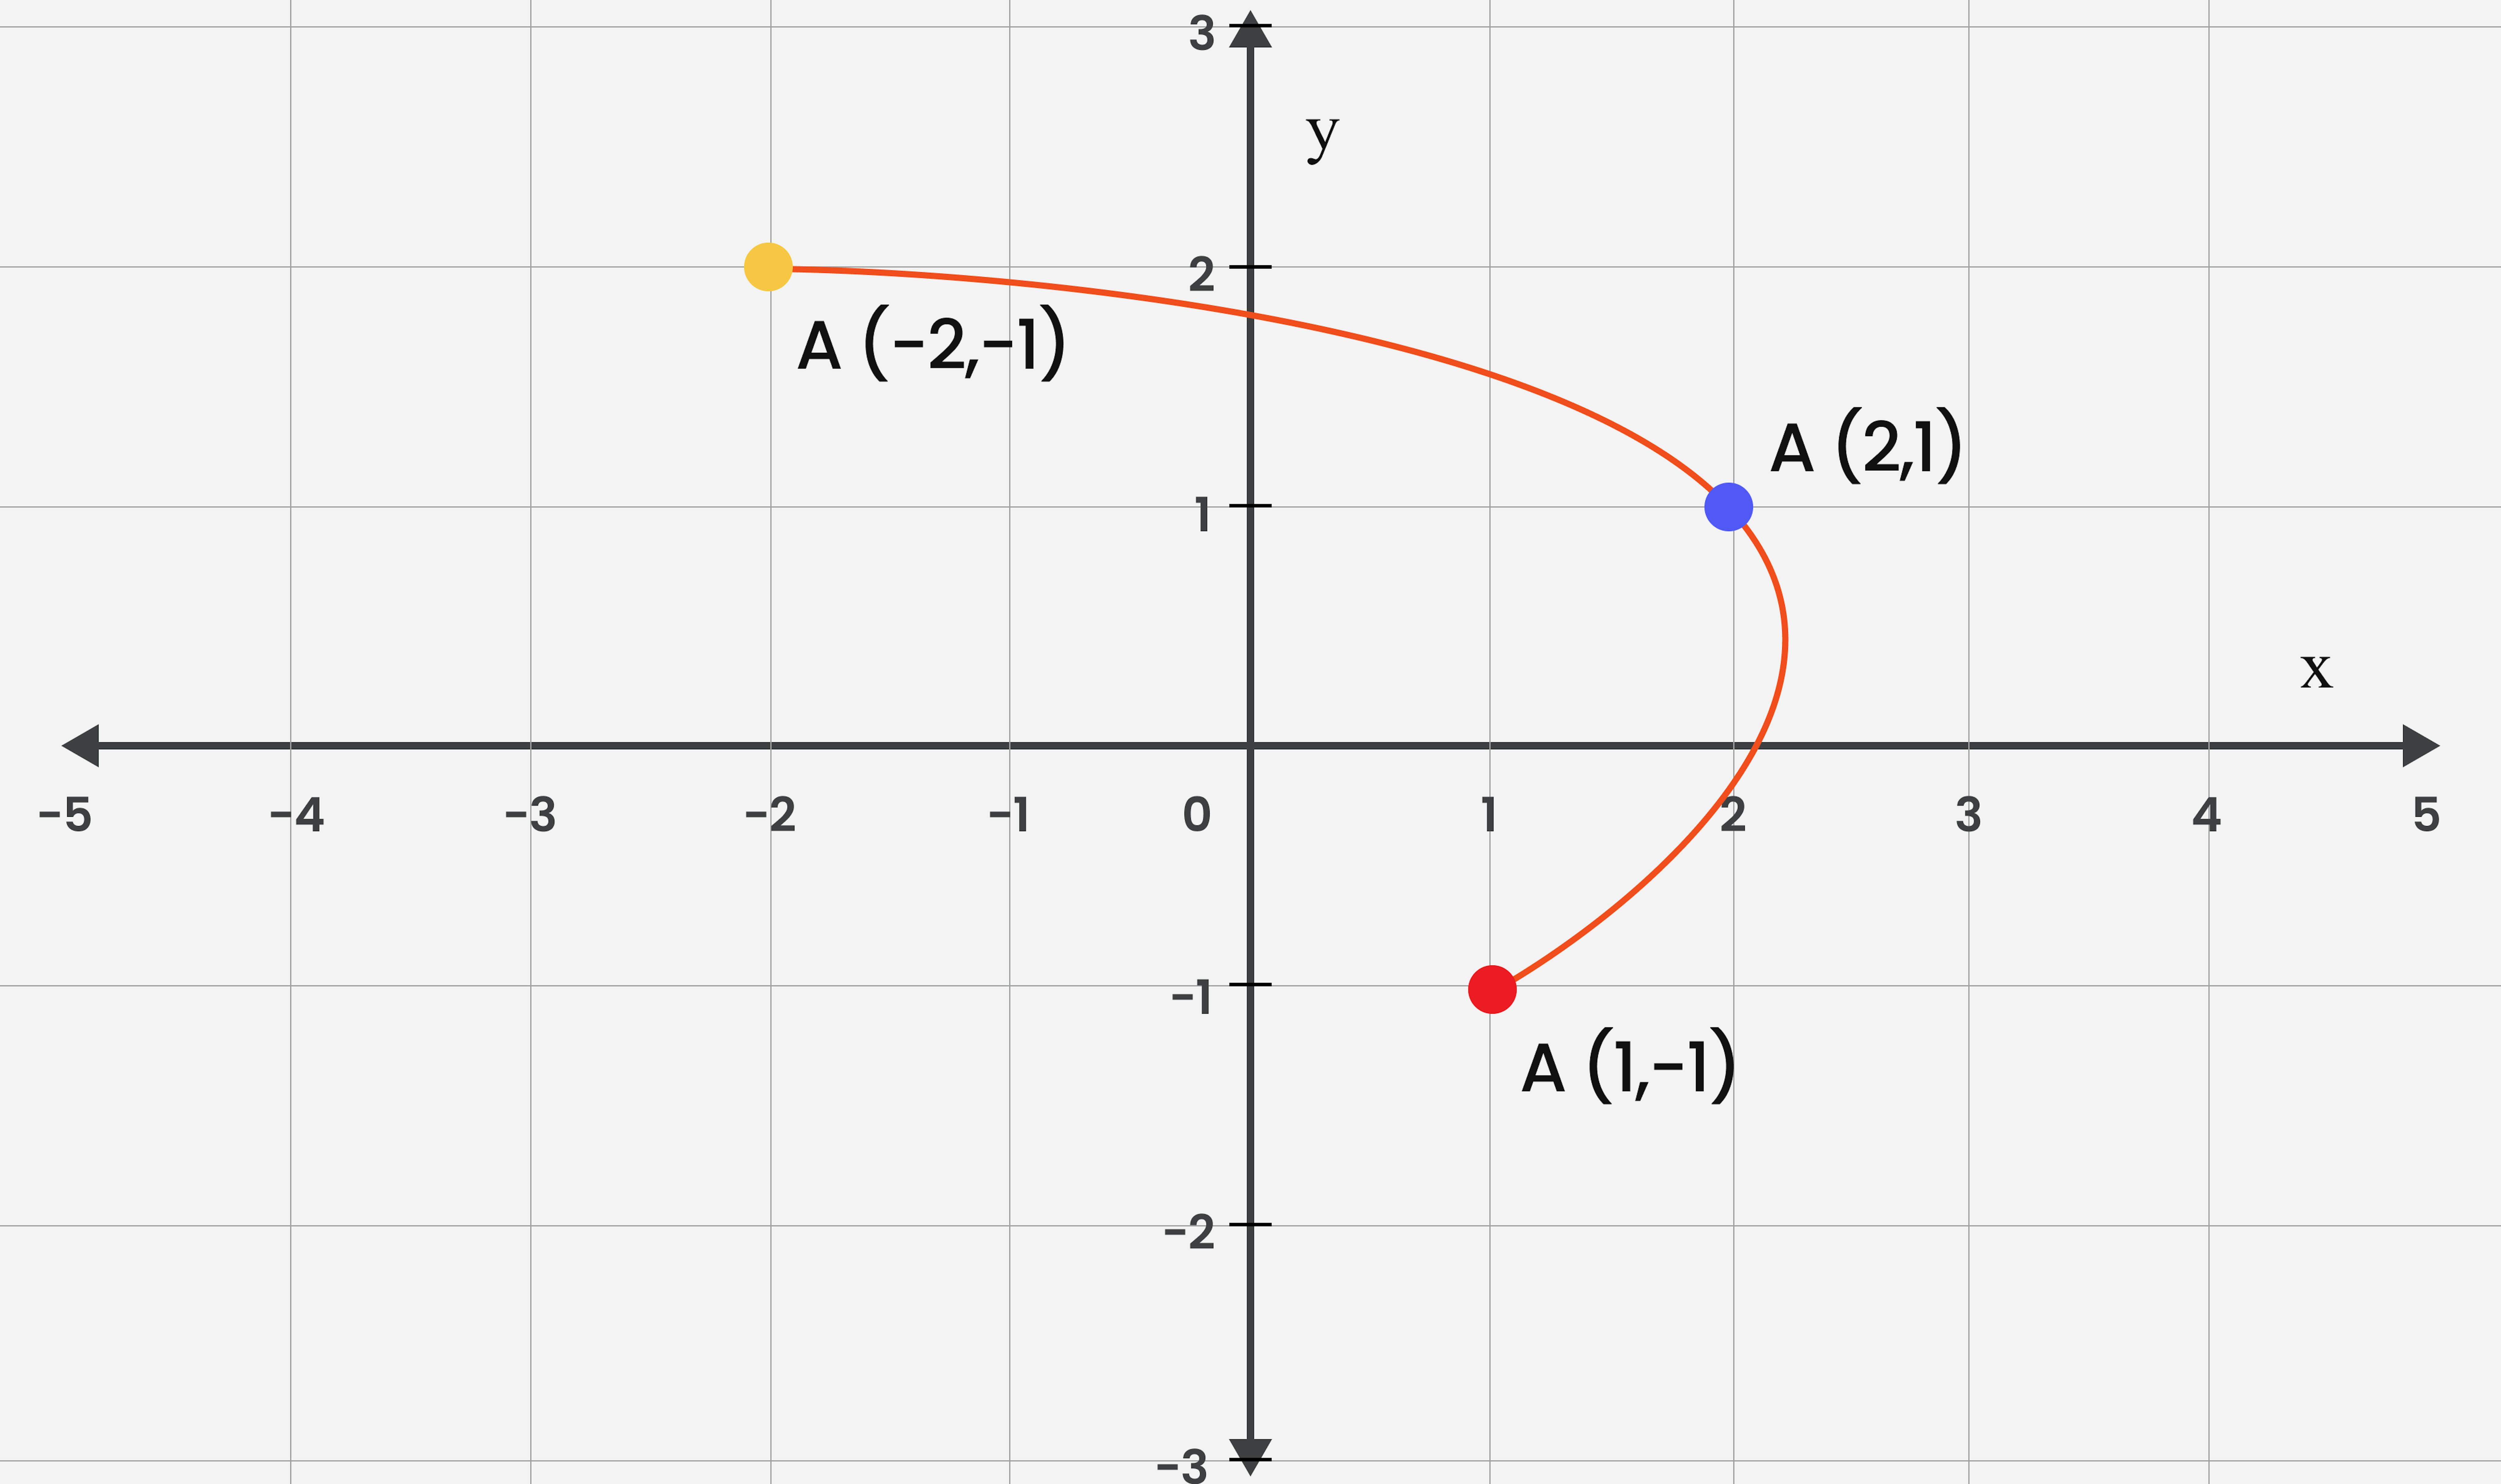
You probably remember how we were taught about the coordinate system and graphing it at school. And you also remember how boring it was to solve equations and find values that meant nothing to us. But when all the values were found, transferred as points, and connected, the meaning immediately became visible and apparent. Well, the burndown chart is the same coordinate system with a graph on it, but it is based on Agile methodology and generated automatically on the Scrum board.
If you already use Jira, you are probably very familiar with the Agile methodology for project management. If not, we highly recommend reading our article about it. There we explain in detail what the Agile methodology is. Also, why is it so useful, and how to start using it precisely with Jira.
It looks like the vertical axis represents the number of tasks, and the horizontal axis represents the amount of time in the sprint. At the beginning of the sprint, you are at maximum vertically and at zero horizontally. As you sprint, you constantly move horizontally to the side, and as you complete tasks, you move vertically to the bottom. The sprint is successfully completed if you are at zero on the vertical scale by the end of the horizontal scale.
If you are not at zero vertically by the end of the horizontal scale, the sprint is obviously not successful. You can also get close to zero vertically in the middle of the horizontal scale, but that doesn't make the sprint successful either.
And here is the power of this tool. Scrum board allows you to manage the tasks. Burndown chart allows you to rate their management and completion and make it transparent, predictable, and efficient as never before.
Probably you are also familiar with the Agile method called Scrum for accurate project management. In any case, we invite you to read our article, where we explain what Scrum and Kanban methods are and how to choose between them or each type of team or project.
Why use burndown chart?
Many valuable conclusions can be drawn from the productivity dynamics, both for the current and future sprints. Let's take a closer look at what this tool can exactly help.
Planning
It helps to plan the sprint as accurately as possible. Based on how much time with how many tasks and what difficulty the team has completed, you can give them the maximum, but not excessive, number of tasks in the next sprint that they are sure to handle. Consequently, it is possible to give specific guarantees of the completion of a certain amount of work to the customer.
Blockers and deadlines
It is possible to detect blockers during a sprint in time and not exceed deadlines. For example, when suddenly added tasks to a sprint. Or a team starts a particular type of task. Or the particular person comes to complete specific tasks. All it can make the time spent on the tasks much longer than expected, and the entire team is out of schedule. This becomes immediately visible on the graph and allows it to influence this in time.
Team expertise
It also helps determine how good a team is for this kind of task. It cannot be easy to assess such contingent and abstract things without such tools accurately. For example, you can be completely confident in your team but still overestimate their capabilities relative to the number of tasks assigned. Or you can take very promising interns but still overestimate their qualifications relative to the complexity of the tasks assigned to them. A good manager knows his team's capabilities, but this chart is also incredibly helpful to clearly see the real situation and make some improvements in the team management or team composition.
How to use burndown chart?
Well, now you understand how the burndown chart works and why you should definitely use it. But now, let's take a closer look at how exactly it should be used and what it requires.
Set estimation statistics
To measure anything, you need to decide on the units of measurement. You have the option of using count of issues, story points and original time estimate. Using issue count is the simplest but the least accurate of the others because it doesn't account for the complexity of the tasks and doesn't account for differences in time to complete them. That's why we don't recommend it, but depending on the project, the management, and the team's wishes, it might be the preferable option.
You can set the estimation statistics in the Scrum board settings in the estimation section. After that, you can start creating the burndown chart.
Сreate the burndown chart
To create a burndown chart, go to reports and select it among the others. Again, you will need to choose the units to display data for this report, count of issues, story points, or original time estimate.
Each time you do this, an updated graphic will be generated based on the changes made in the Scrum board. So all changes to the board must be committed, timely and show the actual processes and state of the project as much as possible. Let's look at the main cases that occur most often.
Read the burndown chart
The actual line rapidly began to move straight. It means that the team has stalled on some task, the completion of which depends on the other tasks. Or there is downtime in the processes that provide the necessary conditions for the execution or evaluation of tasks.
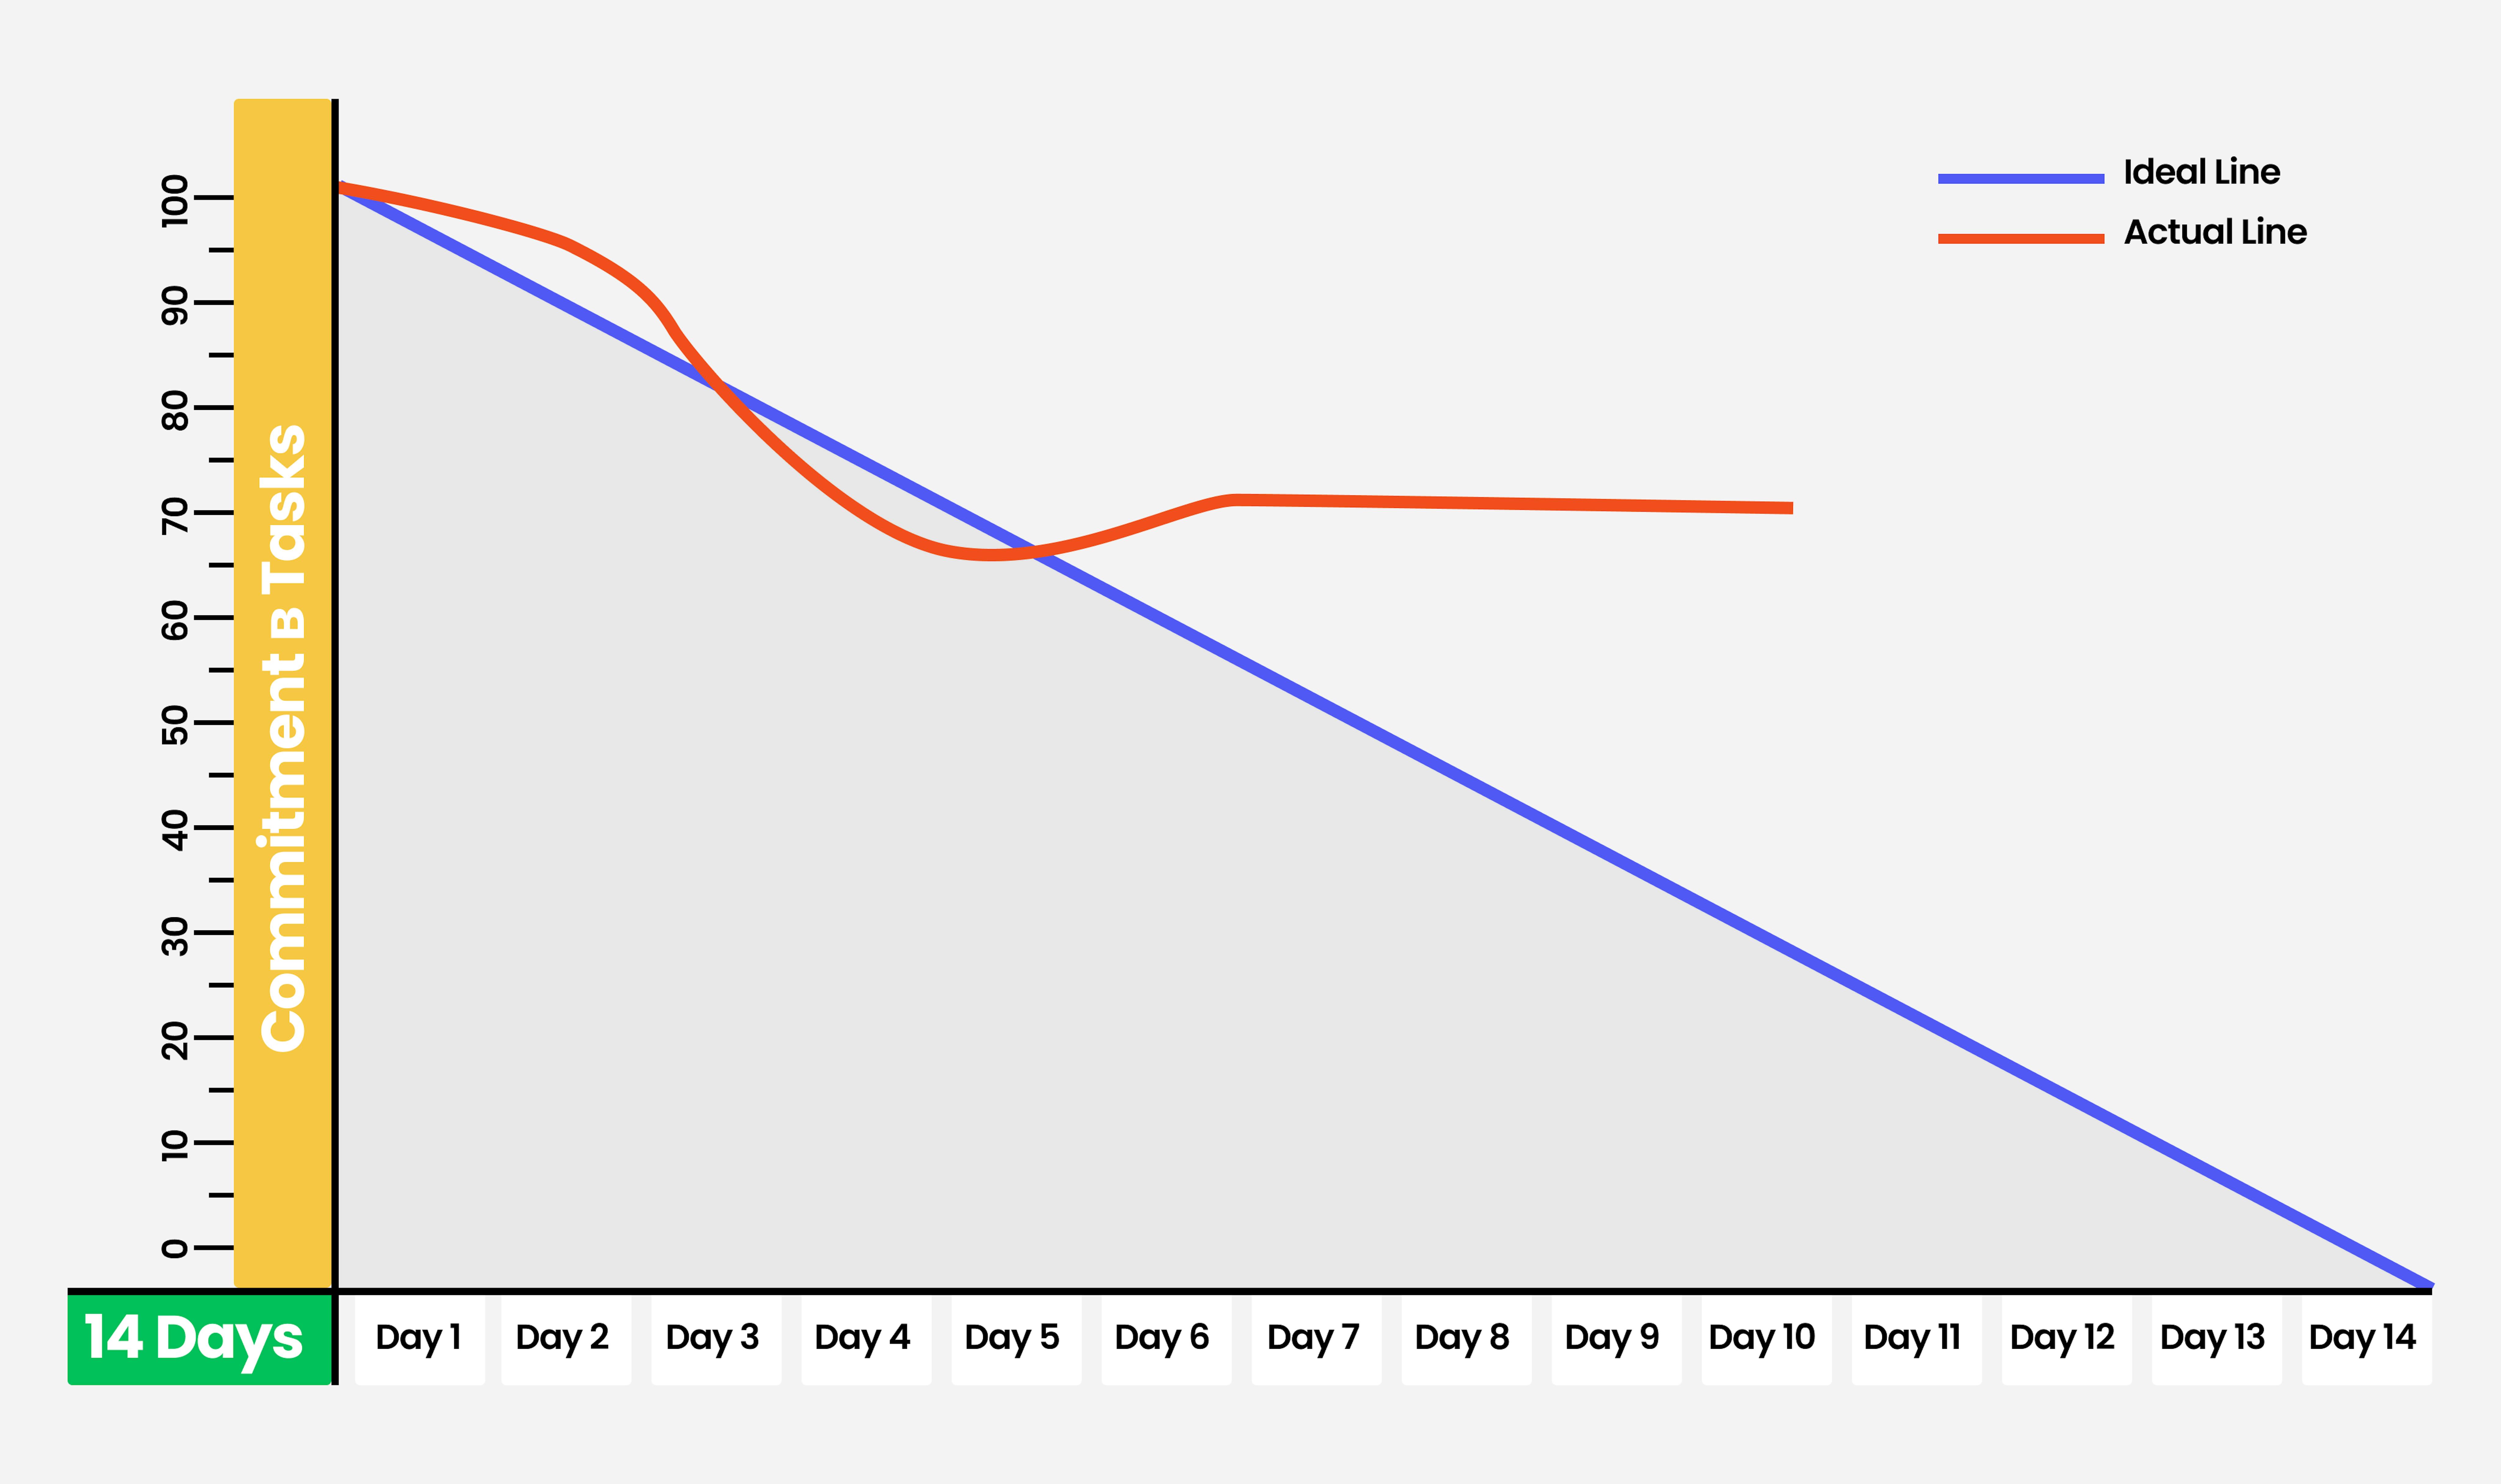
Here are the most common reasons:
- The team does not mark task completion on time.
- The team does not time tasks accurately enough.
- The team cannot start some tasks because they have not yet accessed all stories.
- The team does not have access to some parts of the work environment or has lost access to them completely, such as service failures or work server breakdowns.
How this can be fixed:
- Ensure the team competently estimates and allocates enough time to complete tasks and marks them up on time.
- Ensure that the team has access to all of the stories they need to work on and if it takes extra time to provide access, organize the execution of the tasks for which they have access.
- Ensure that the working environment and the necessary operational services and tools are fully functional. In case of emergency, find a temporary alternative.
The actual line approached zero before the end of the sprint. It might indicate either an overestimation of task complexity and time to complete or that the team is severely overworked.
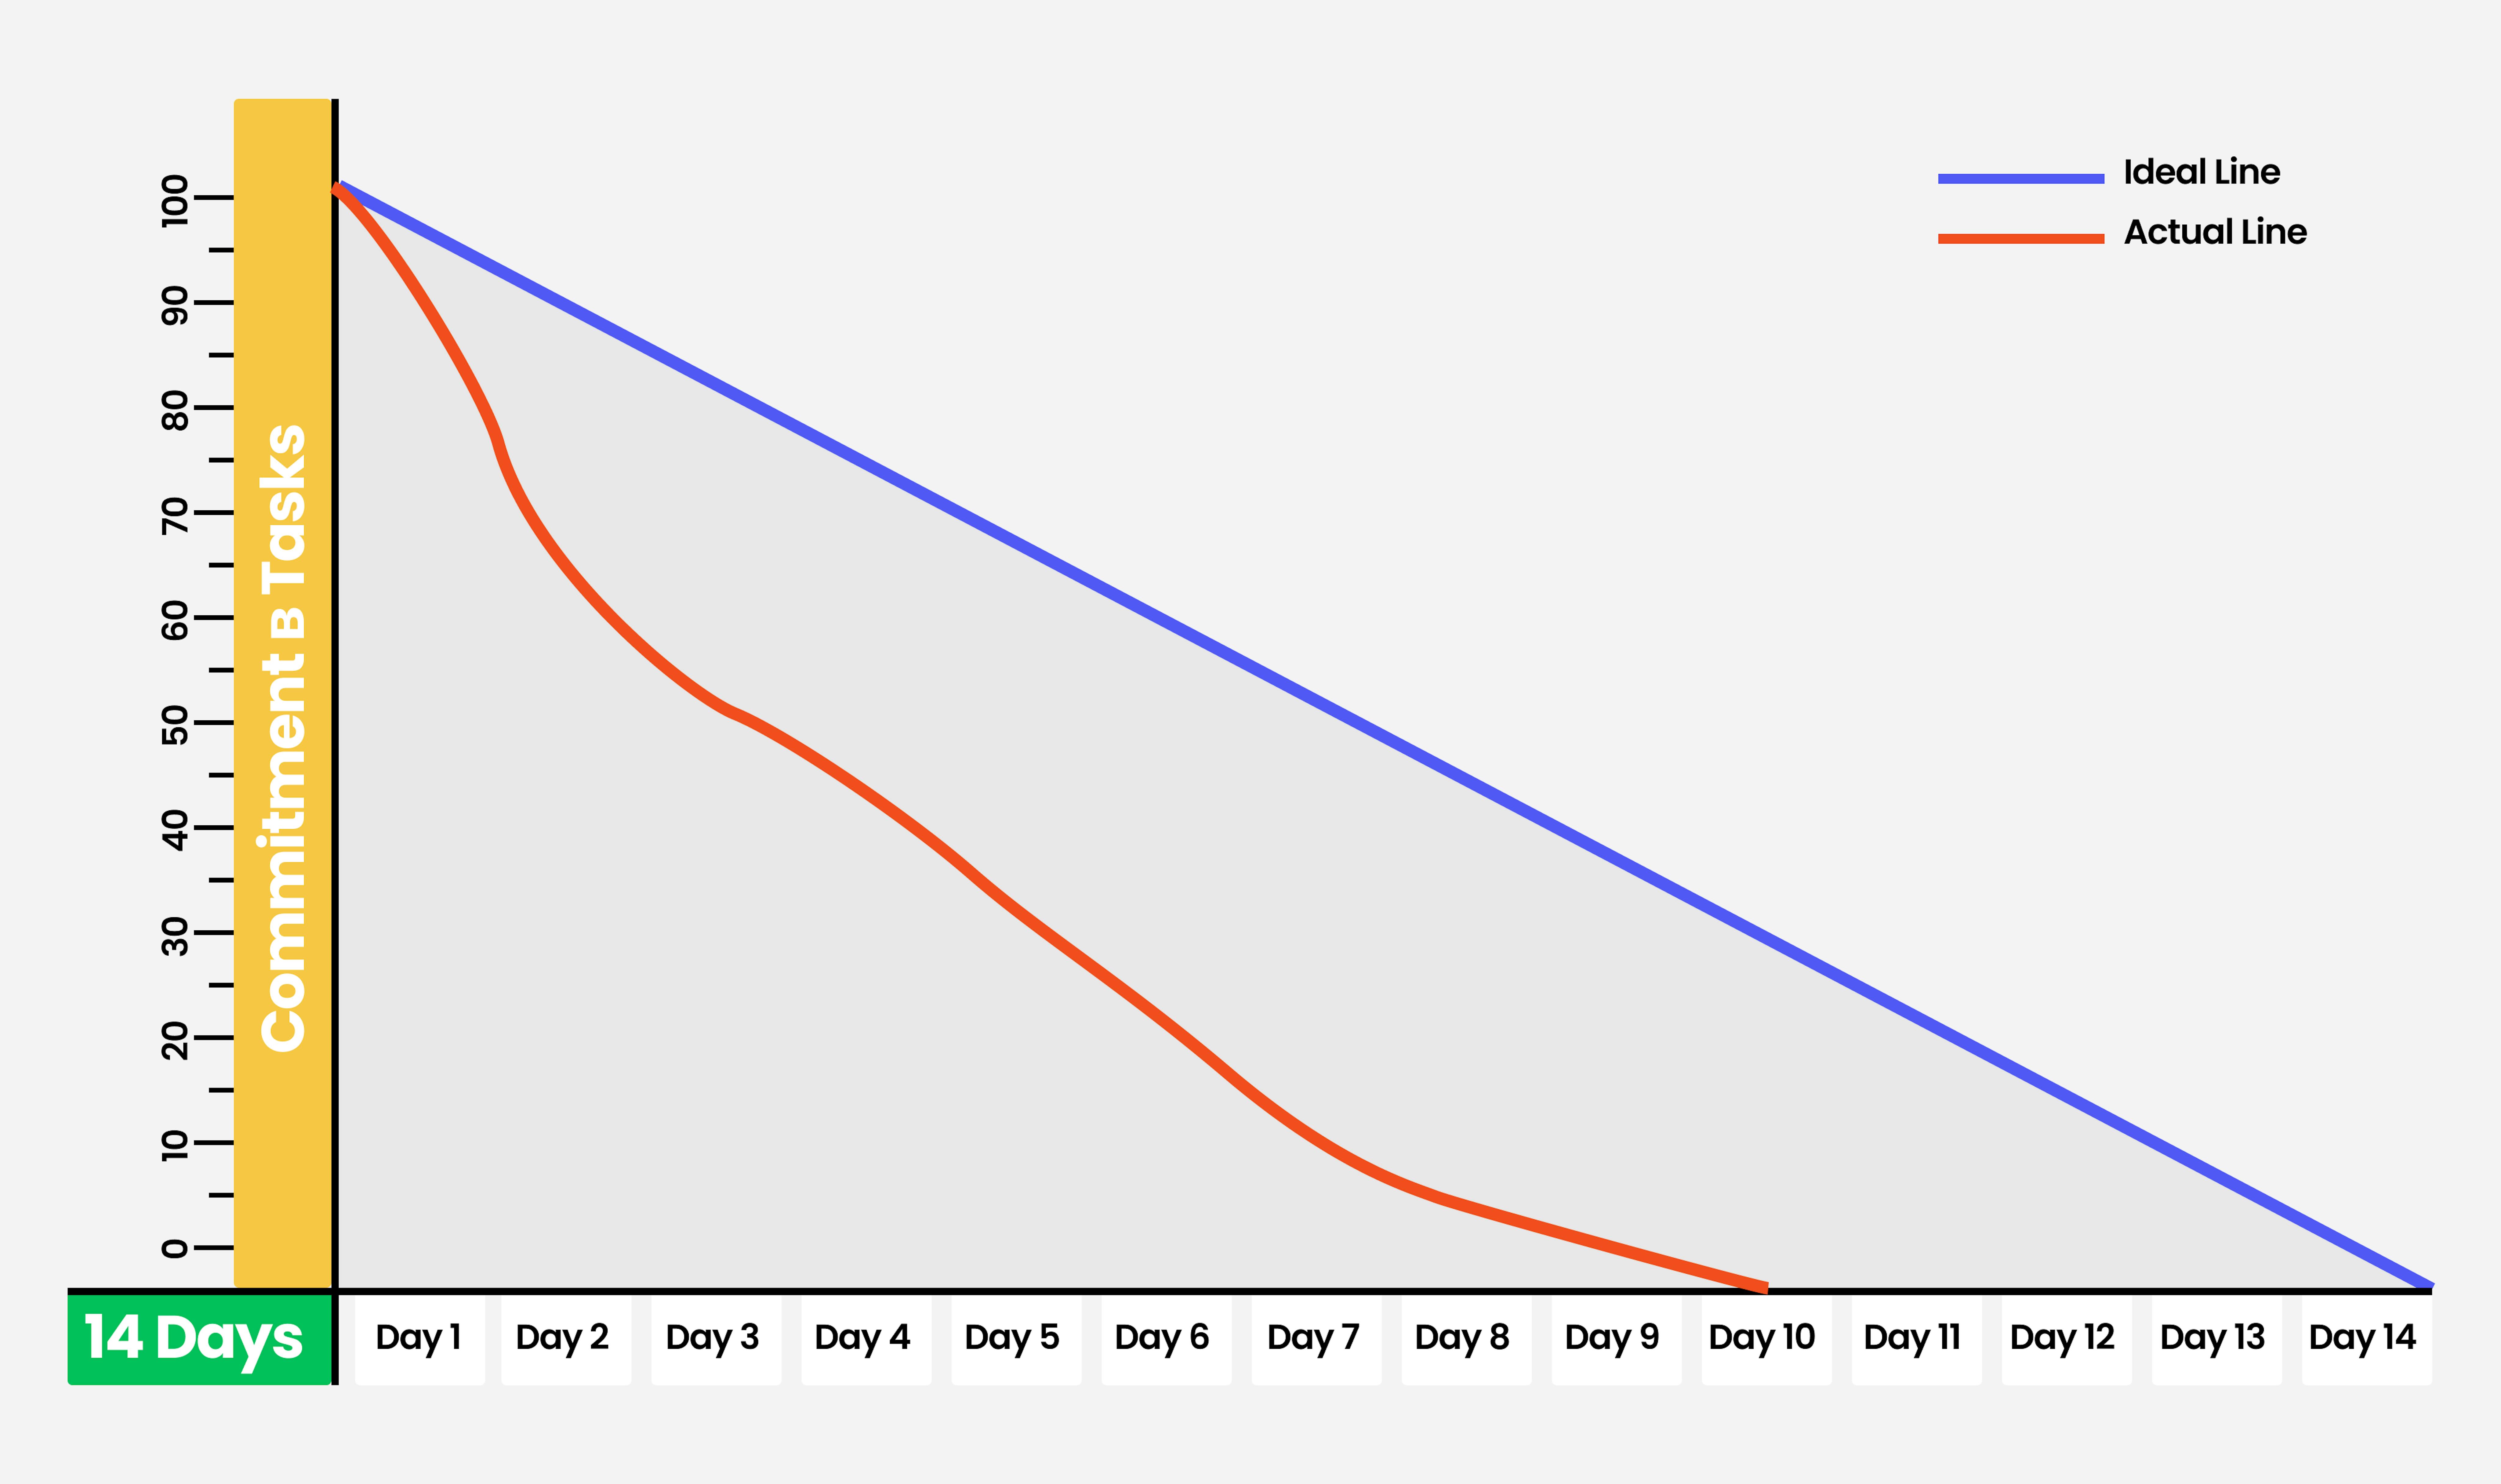
Here are the most common reasons::
- Team management underestimated the team's expertise.
- Team or team management overestimated the complexity of the tasks or time needed for their completion.
- The team works more hours per day than are required to complete a sprint, leading to mistakes in the current sprint or low productivity in the next one.
How this can be fixed:
- Give a more accurate estimate of the difficulty of the tasks and the time required to complete them when planning the sprint.
- Include the optimum number of tasks in the sprint so that each sprint and the team's work will be as productive as possible.
- Eliminate team overwork and distribute physical and mental energy evenly for each sprint since each sprint is equally essential.
The actual line suddenly moved up. This could mean increasing the task list or re-estimating it.
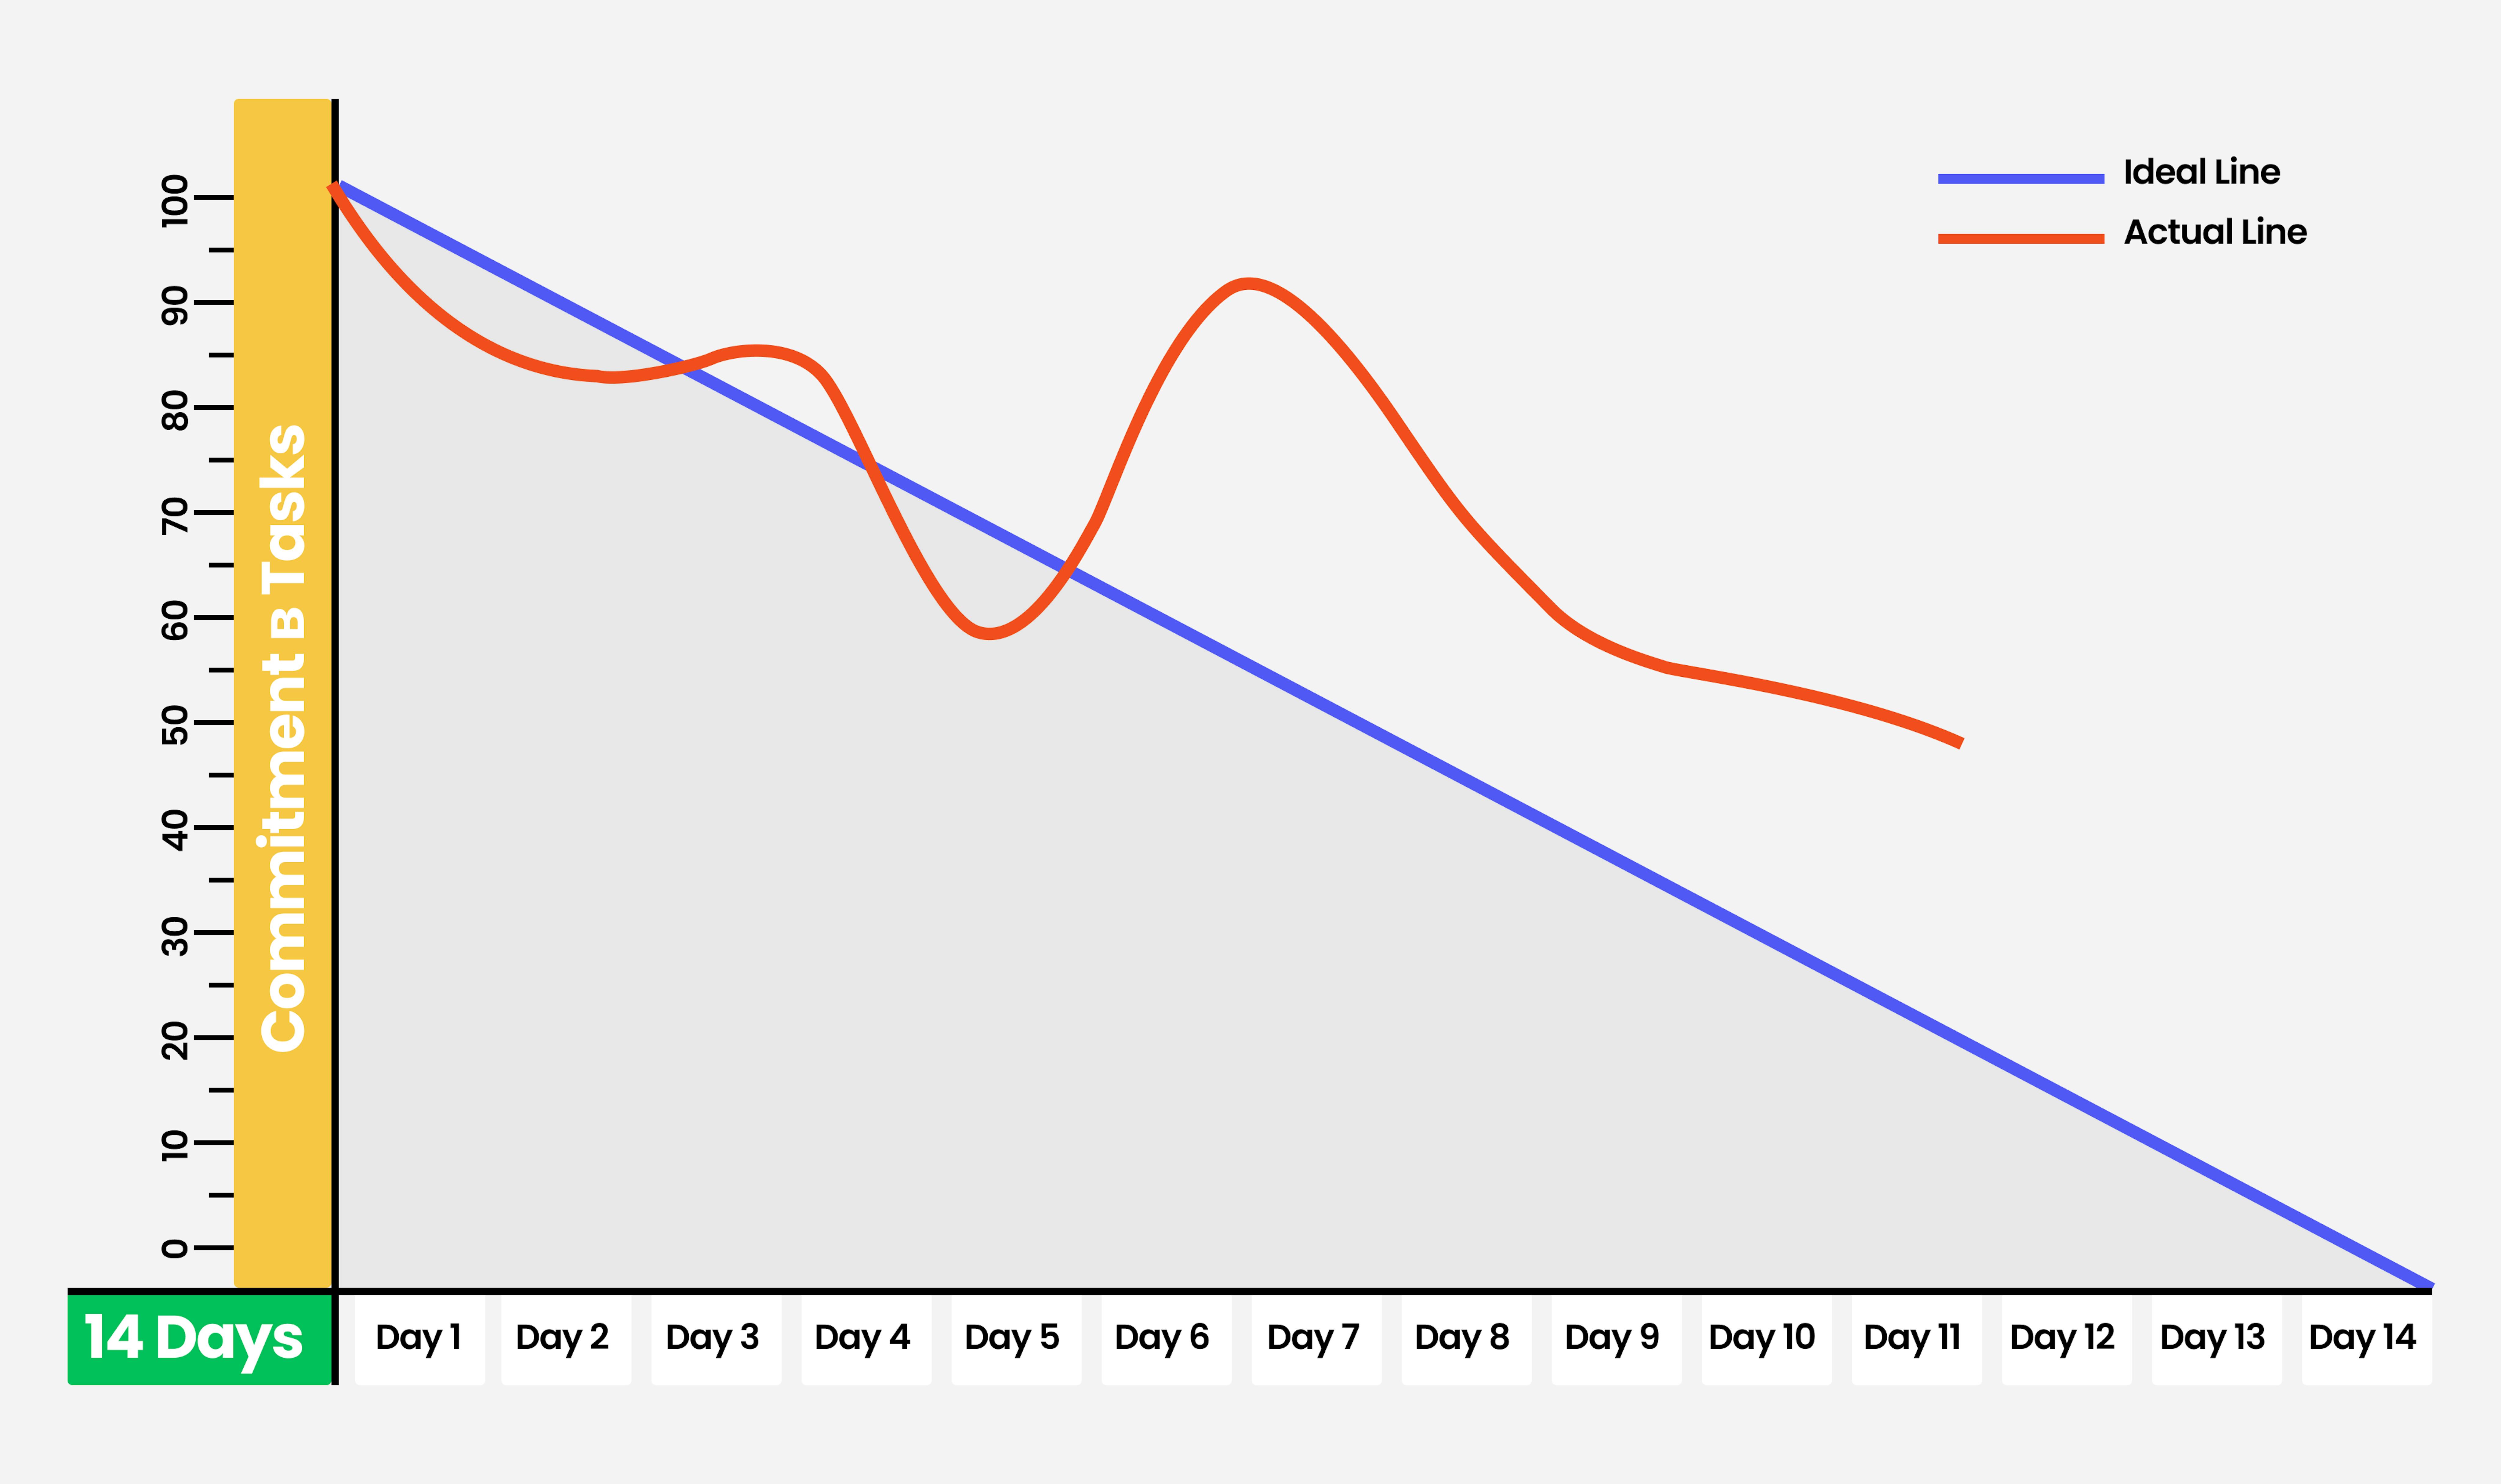
The most common causes are:
- Customer or team management added new tasks during the sprint.
- The team estimated again the difficulty of earlier tasks, and team management allotted more time to complete them.
How you can fix this:
- You need to plan the sprint more carefully, divide the tasks into more subtasks, and estimate the difficulty and time to complete them more expertly.
- If this does happen, you should not decrease or even increase your work speed so that the actual line again tends to zero at the end of the sprint.
The actual line does not tend to zero. This can happen when a team fails to meet the objectives and does not meet them by the end of the sprint.
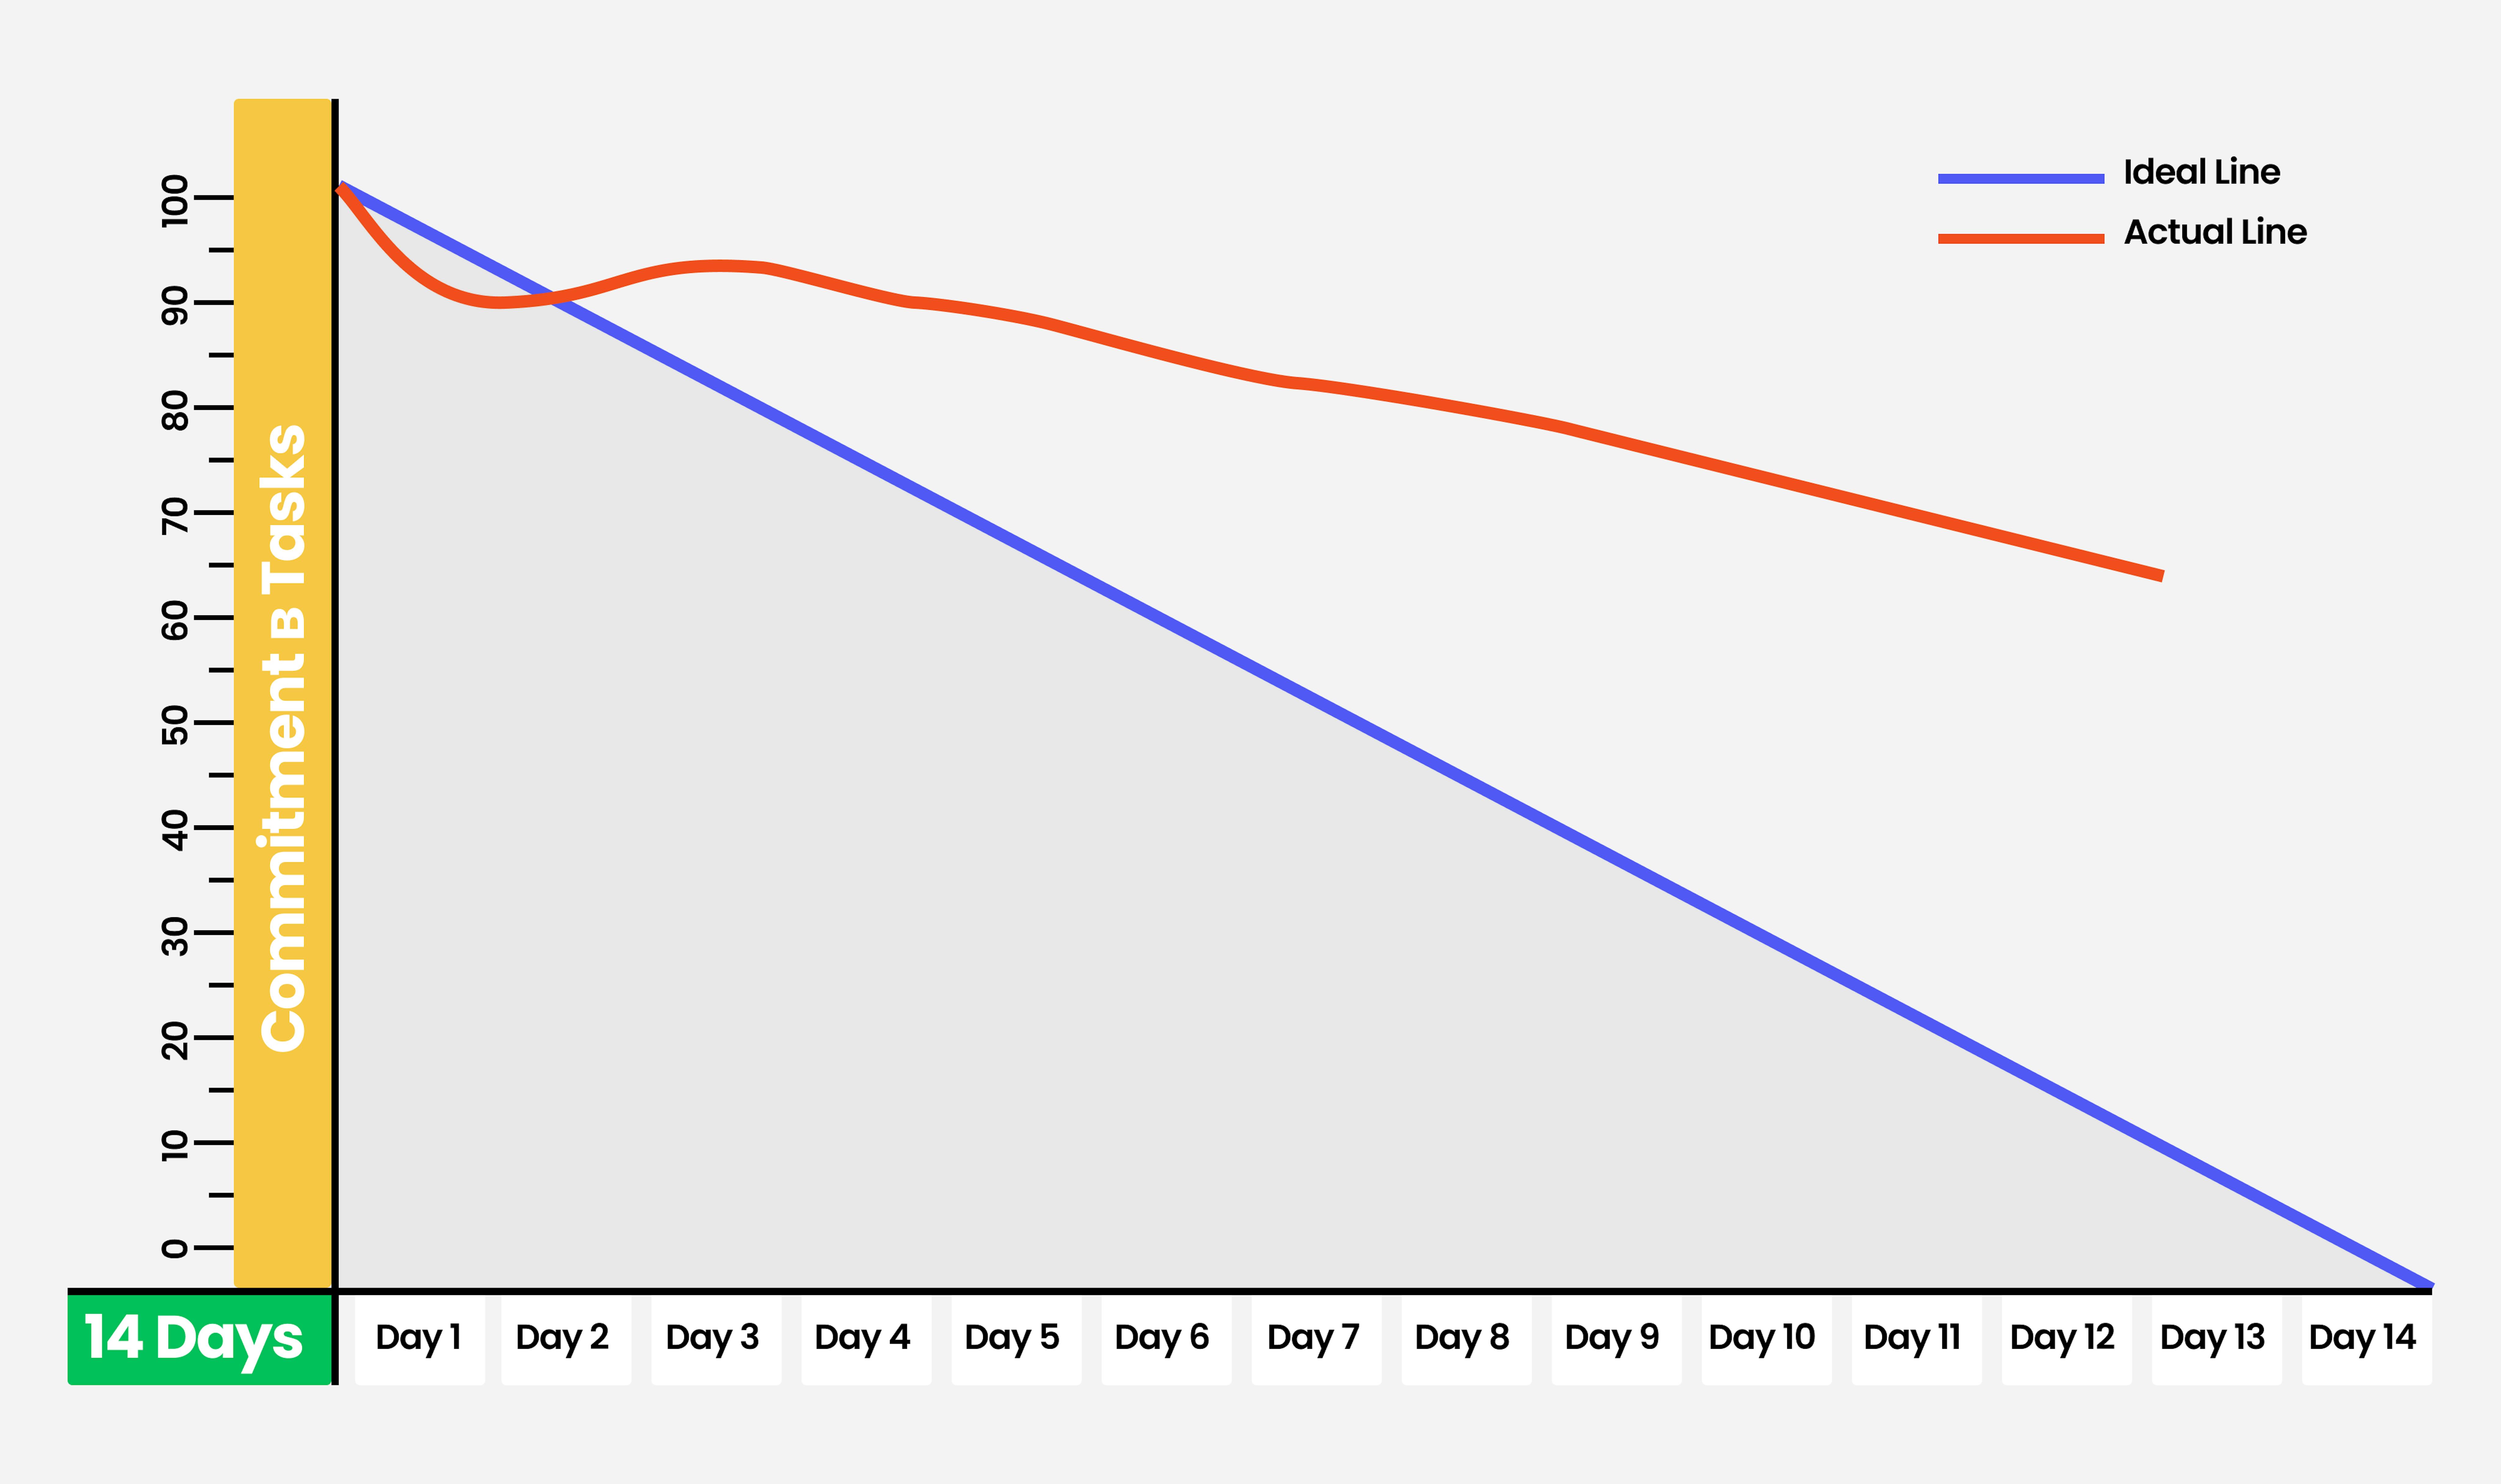
The most common causes are:
- The team doesn't mark tasks completed on time.
- The team is having problems with their work environment.
- The team fails to complete tasks because they are too numerous or complex.
- Team management underestimated the time required to complete the tasks or the team's composition to complete them.
How you can fix this:
- First, ensure that the team marks the tasks on time and that all work environments are functioning correctly.
- Break tasks into as many subtasks as possible, re-estimate the complexity of all tasks and the time needed to complete them.
- Increase the number of team members working on them, and provide more expert members if needed.
Straight lines with sharp drops. This can be if the chart is built on the issue count or if their completion is marked not on time.
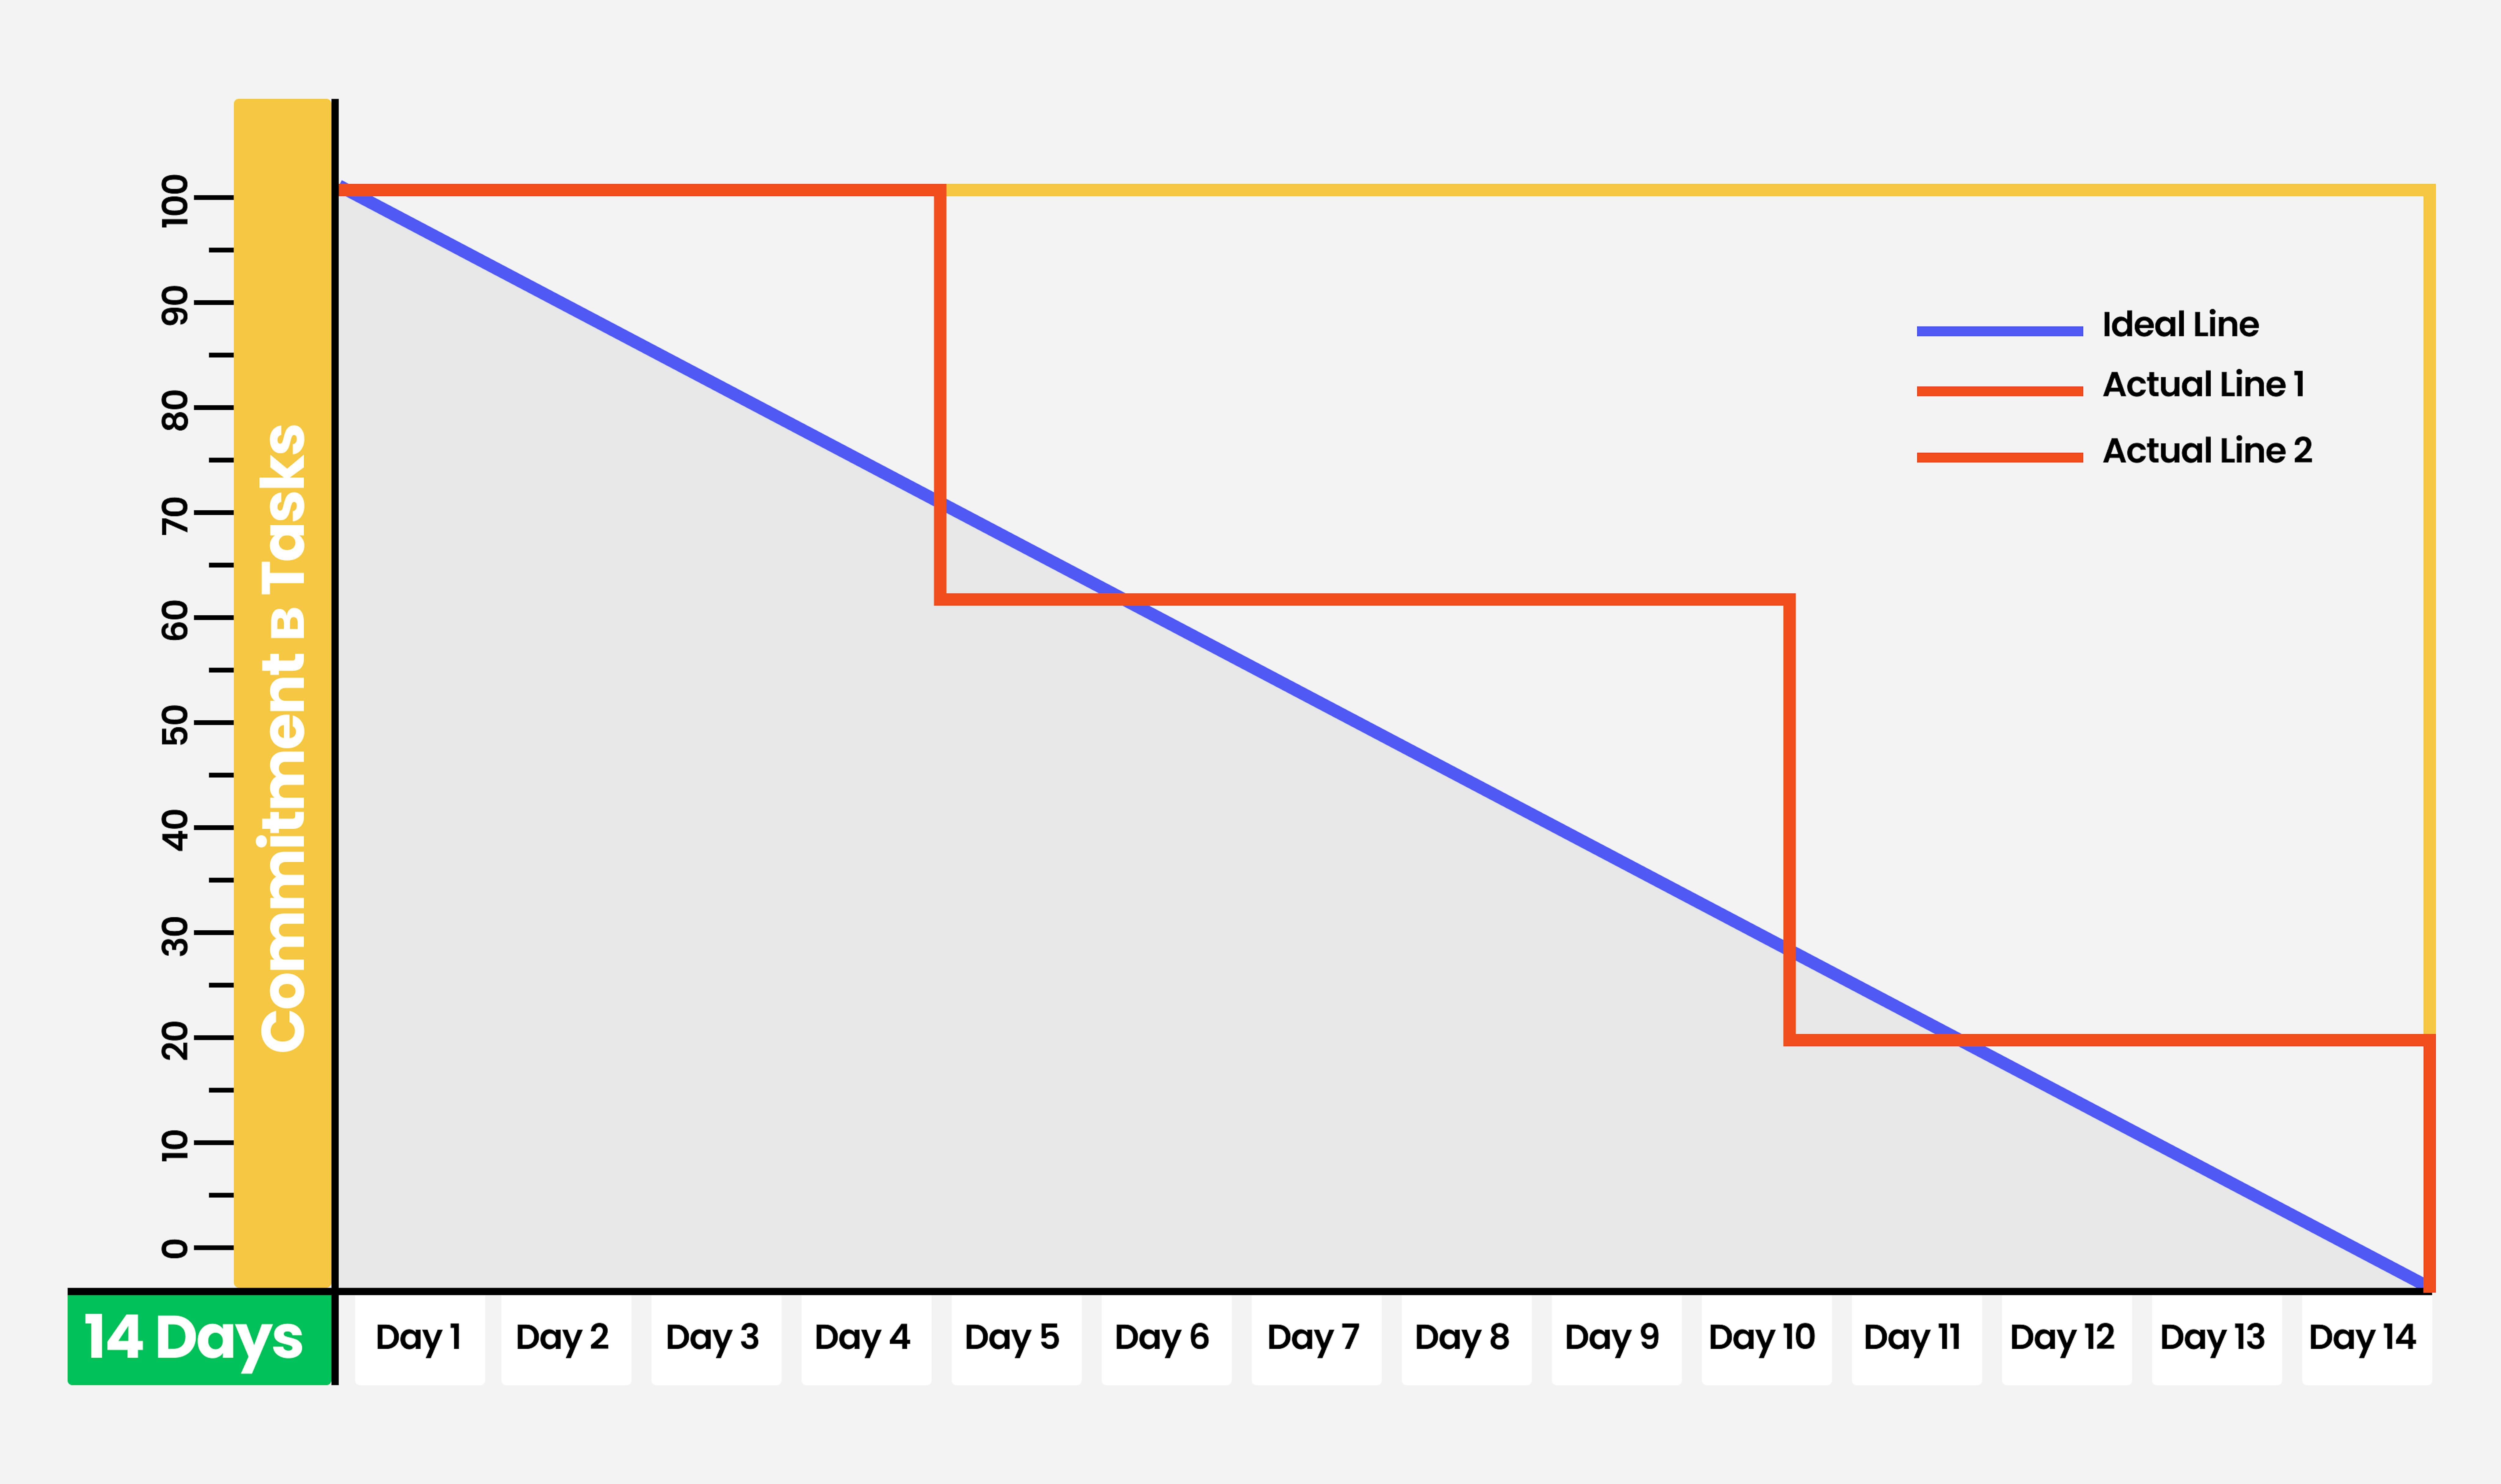
Here are the most common reasons:
- The chart is built on the issue count, which doesn't account for the time to complete them.
- The team does not mark tasks for completion on time but at the end of the day or sprint.
How this can be fixed:
- You should use time points instead of issue count for a more accurate graph, as we've advised before.
- Organize the team to mark tasks as timely as possible.
Summary
You can have real professionals, and you won't have a professional job if you don't organize their work in the best way possible. But we live in a fantastic time. We have not only excellent methods for getting hundreds or thousands of people under the same roof and getting them to work together, like Kanban or Scrum. We also have incredibly powerful platforms and tools that allow people from different continents to work together and use those methods more productively than ever.
For example, we at Mad Devs have long been actively using Jira and many of its tools, allowing us to take talented people from all over the world and organize their work, which gives excellent results. You can check out our cases here.
The only thing you need to succeed today is a good idea and talented people ready to realize it. And everything else is already working for you with unbelievable power. It's just worth getting to know it. And that will make it possible to create unique products that will make the world a better place or even completely change it, in a good way.


